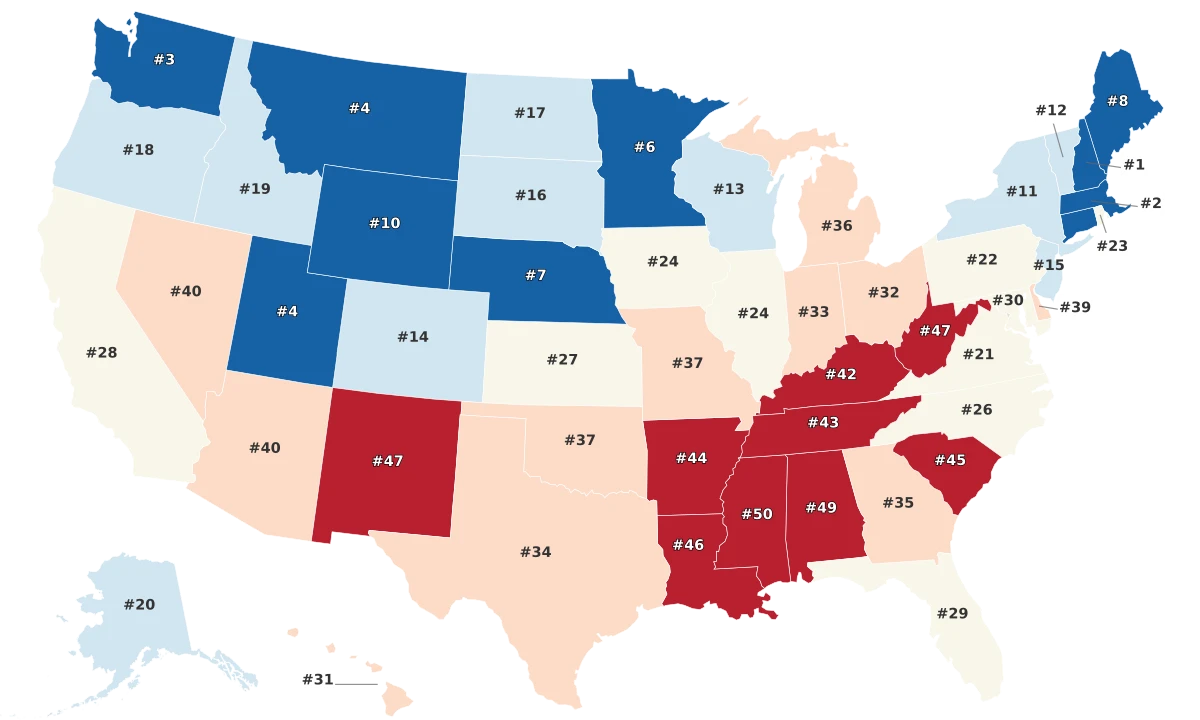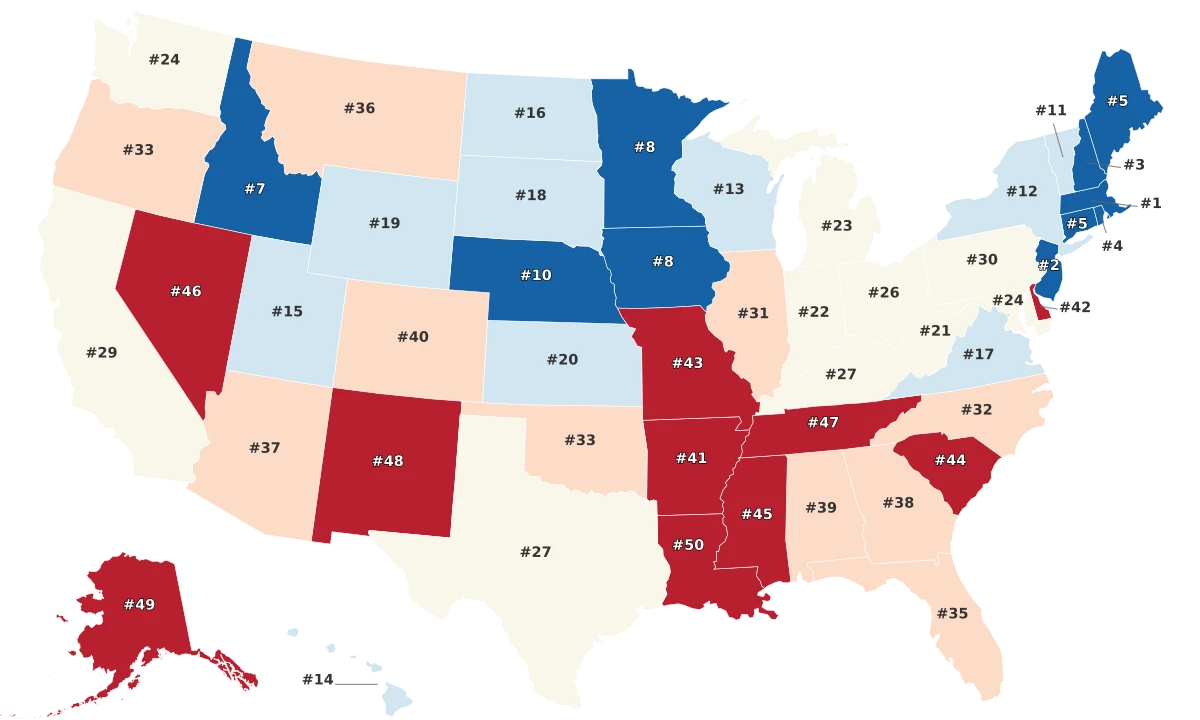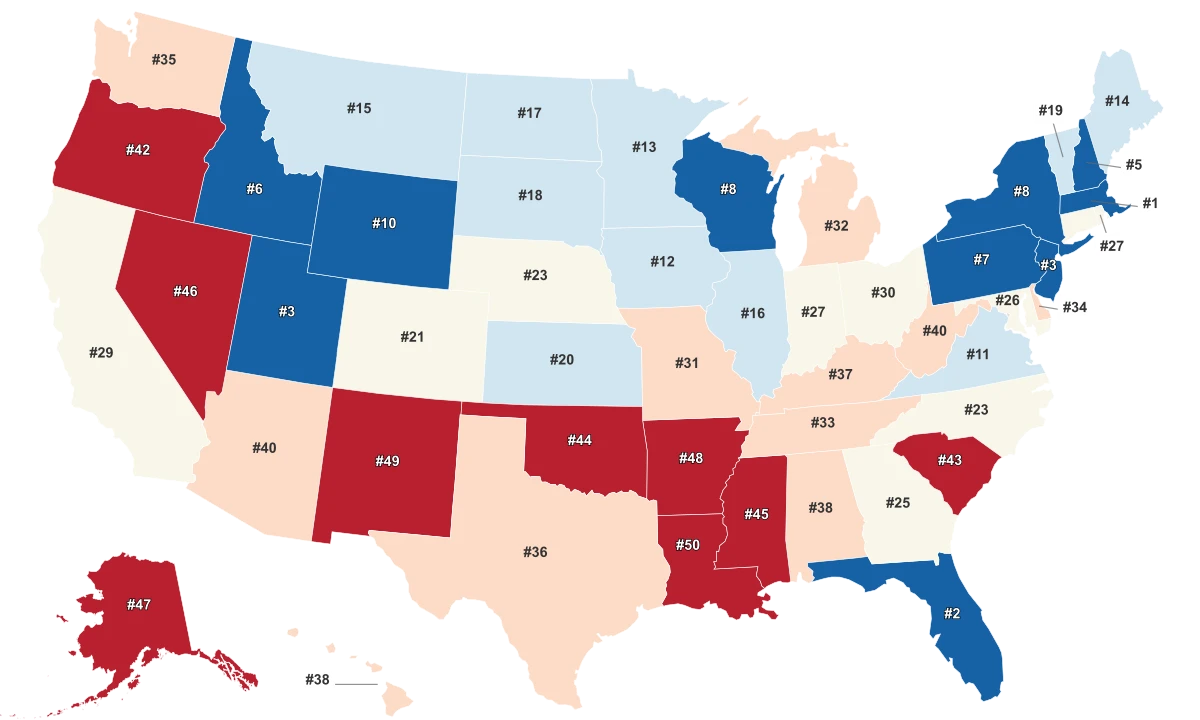


















































Key Takeaways
- Massachusetts tops the 2024 Quality of Life Index with a score of 60.5, edging out Florida at 59.8.
- Louisiana sits at the bottom at 41.3, a 19.2-point spread from the leader across the 50 states.
- The score is a WalletHub composite of 51 livability indicators, so it rewards cost, safety and infrastructure, not how residents feel.
- Hawaii ranks first in the nation for both life expectancy and happiness, yet lands 38th of 50 on this index.
What the Quality of Life Score Actually Counts
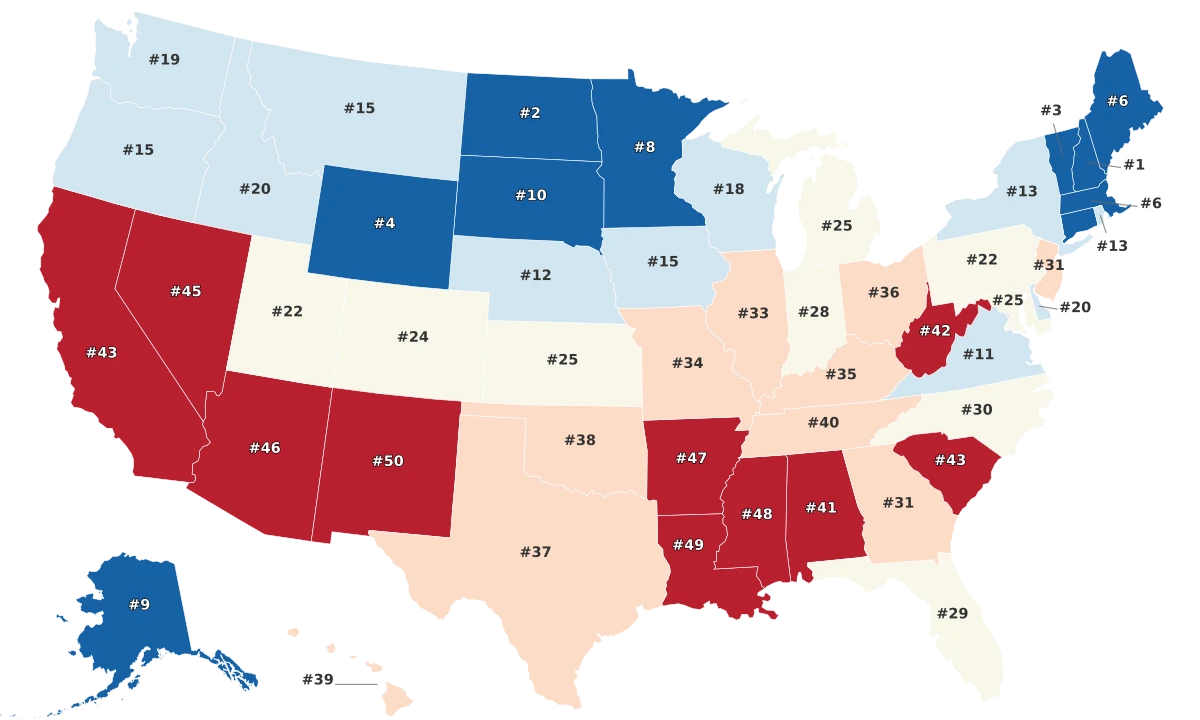
Massachusetts posts the highest Quality of Life Index in the country at 60.5, while Louisiana anchors the bottom at 41.3, a difference of just over 19 points end to end. Most states crowd the middle, near a typical score of 52, with only a short stretch of states pulling away at the top and a thin tail sinking at the bottom. A higher score is better here: it signals more favorable living conditions, not a worse-run state.
The number comes from WalletHub's 2024 Best States to Live In study, which compares all 50 states across five weighted dimensions and 51 underlying indicators, each graded on a 100-point scale and rolled into one weighted average. That construction matters before any state is praised or pitied. Affordability is one of the heaviest pieces, with cost of living alone carrying quadruple weight, so an expensive state pays a structural penalty regardless of anything else.
So this is not a survey of residents or an official government statistic. It is a constructed estimate of livability conditions, and reading it well means knowing what it counts.
Hawaii Lives Longest, Yet Ranks Near the Bottom
If quality of life meant living long and feeling good, Hawaii would run away with this ranking. It does the opposite. The state holds the nation's highest life expectancy at 79.9 years, according to the CDC's 2021 state life tables, and it tops the happiness measure in this dataset as well. Yet on the Quality of Life Index it lands 38th of 50, with a score of 48.5, almost four points below the typical state.
The composite explains the gap. Hawaii's longevity is built on low smoking and obesity rates, a temperate climate that makes year-round outdoor activity easy, and strong healthcare access, factors The Hill traces to the state's health outcomes. None of that offsets the cost of living, which the index weighs heavily and where Hawaii ranks near the very bottom.
The result is a state where people demonstrably live longer and report being happier than anywhere else, ranked below 37 others on a scorecard built to measure livability. The lesson is not that Hawaii is a hard place to live. It is that this index measures the price and logistics of a place, not the length or the feel of a life inside it.
Happiness Is the Weakest Predictor of the Score
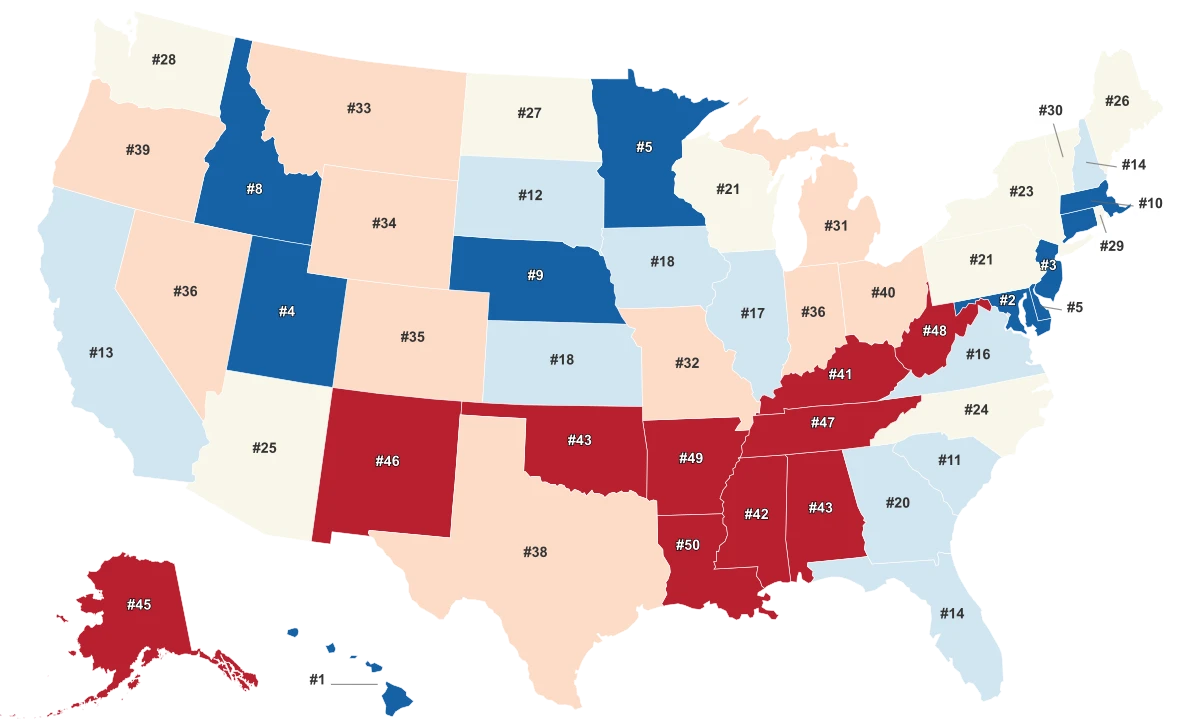
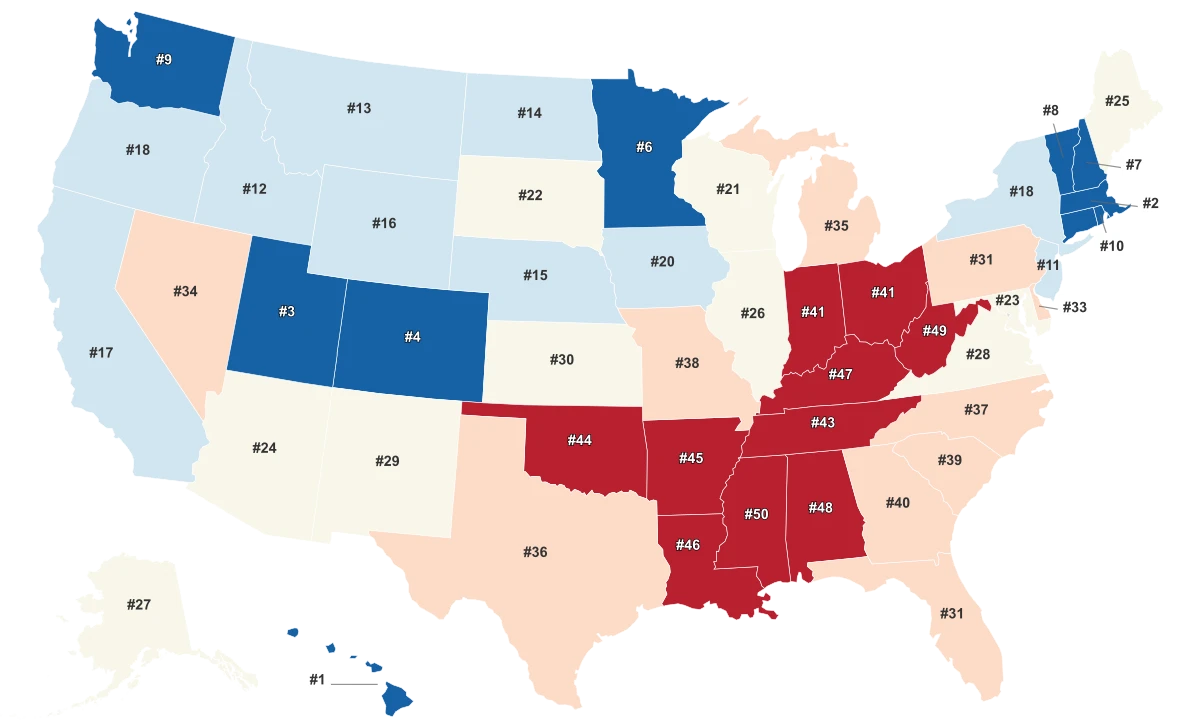
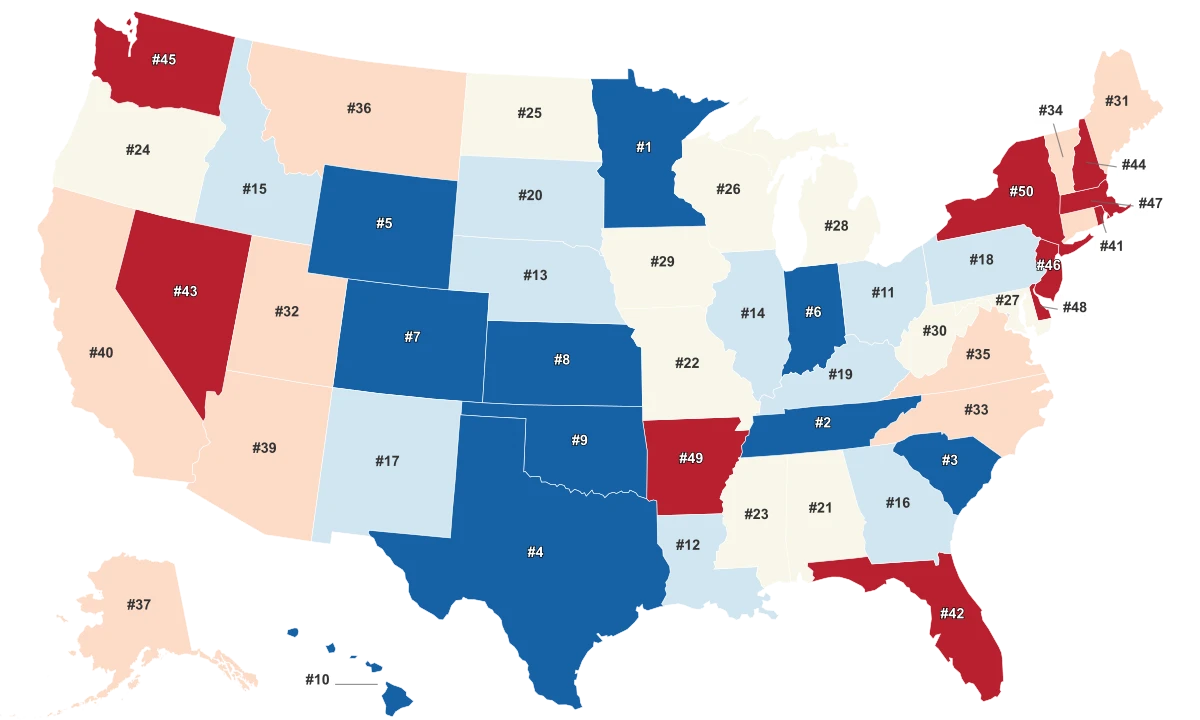
Of the three measures that sit alongside the Quality of Life Index, the one most people would equate with quality of life turns out to track it least. Happiness explains only about a third of the variation in the composite across the 50 states. Life expectancy does better, accounting for a little over four in ten points of variation, and a separate livability index does best of the three, explaining a little under half. Each of those relationships holds up reliably across all 50 states, but none is close to a one-to-one match.
A State Can Be Happy and Still Score Low
Happiness explains only about a third of the variation in the Quality of Life Index across the 50 states, with several happy states sitting well below the trend.
That loose link is the whole point. The livability index that tracks the score most closely is itself another all-in composite built from overlapping ingredients, so its agreement is more confirmation than discovery, and its source and data year are not labeled in this dataset. Happiness and longevity pull in their own directions, which is exactly why a state can clear the top of one list and fall to the bottom third of this one.
The Score Runs Downhill From the Northeast
The clearest pattern in the index is geographic. The Northeast averages 56.9 on the Quality of Life Index, the Midwest 54.3, the West 50.9, and the South trails at 49.6, a steady slope of more than seven points from top region to bottom. The structural reason is the same one that builds the score: the Northeast pairs strong education, health and safety systems, the dimensions the composite rewards, even where housing runs expensive.
At the floor sit two states that fall further below the national average than any others, Louisiana at 41.3 and New Mexico at 41.8. Their problem is not cost but capacity. The deep-South cluster carries the nation's highest poverty and weakest health systems, and Mississippi's health system has been described in the medical literature as "perennially ranked as the worst-performing in the country." When economy and health drag, the composite has little to lift.
That is the quiet argument inside a quality-of-life ranking. It is less a verdict on where life is good and more a map of where the conditions for it are stacked, by cost in one direction and by capacity in the other.