One Number, Fifty Definitions
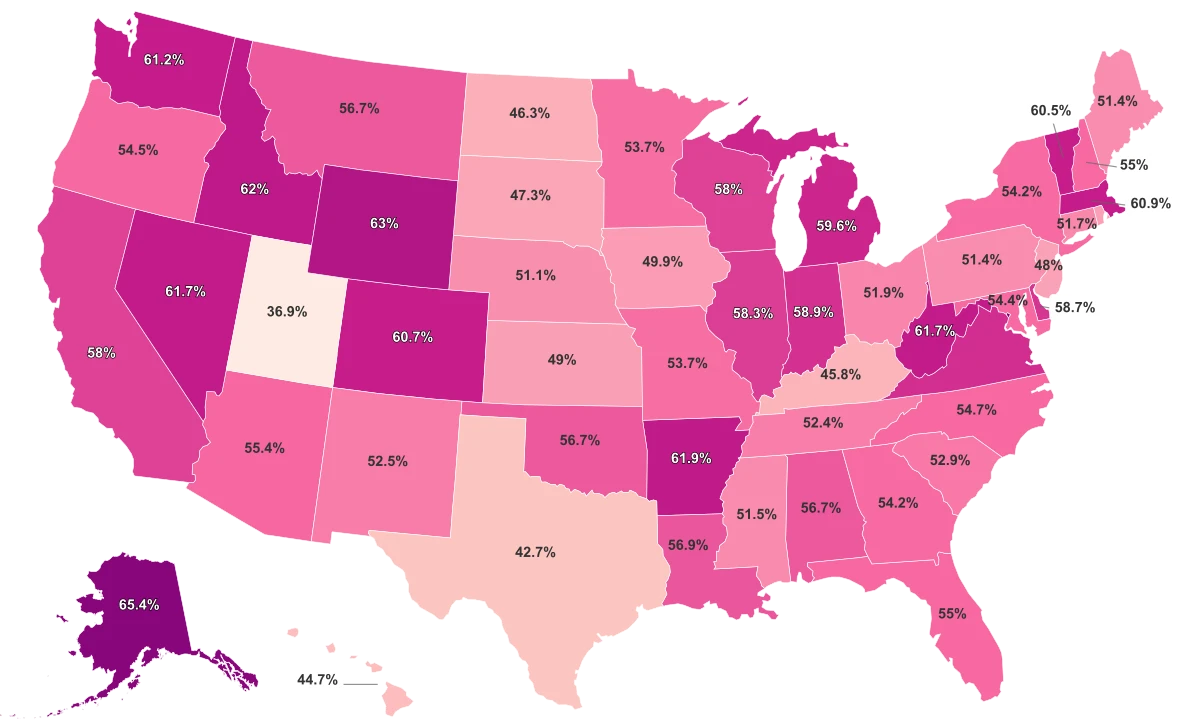
When a state reports a recidivism rate, it is answering a deceptively simple question: of the people released from prison, how many came back within three years? The data here comes from the Council of State Governments Justice Center, which tracked release cohorts in all 50 states over the decade following the 2008 passage of the Second Chance Act. The latest available figures follow people released in 2019.
The range is wide. Alaska leads at 62%, meaning roughly three in five people released from its prisons returned within three years. At the other end, Oregon reports just 13%. The national average sits near 32%, and most states cluster between 20% and 40%, with a handful of outliers pulling the extremes apart.
Here is the critical caveat: each state decides what counts as "coming back." Some states count only new criminal convictions. Others count technical supervision violations: a missed parole appointment, a failed drug test, a curfew breach. A few count any return to custody for any reason. The CSG Justice Center itself warns against direct cross-state comparison for exactly this reason. A state that revokes parole for a single missed check-in will report a higher recidivism rate than a state that reserves reincarceration for new felonies, even if the underlying behavior of released individuals is identical.
That distinction matters for every number on this page. Nationally, about three-quarters of states saw their recidivism rates decline between 2008 and 2019. Nine states posted double-digit drops. But whether those declines reflect genuine reductions in reoffending or changes in how states respond to supervision violations is a question the data alone cannot answer.
Locking People Up Does Not Keep Them From Coming Back
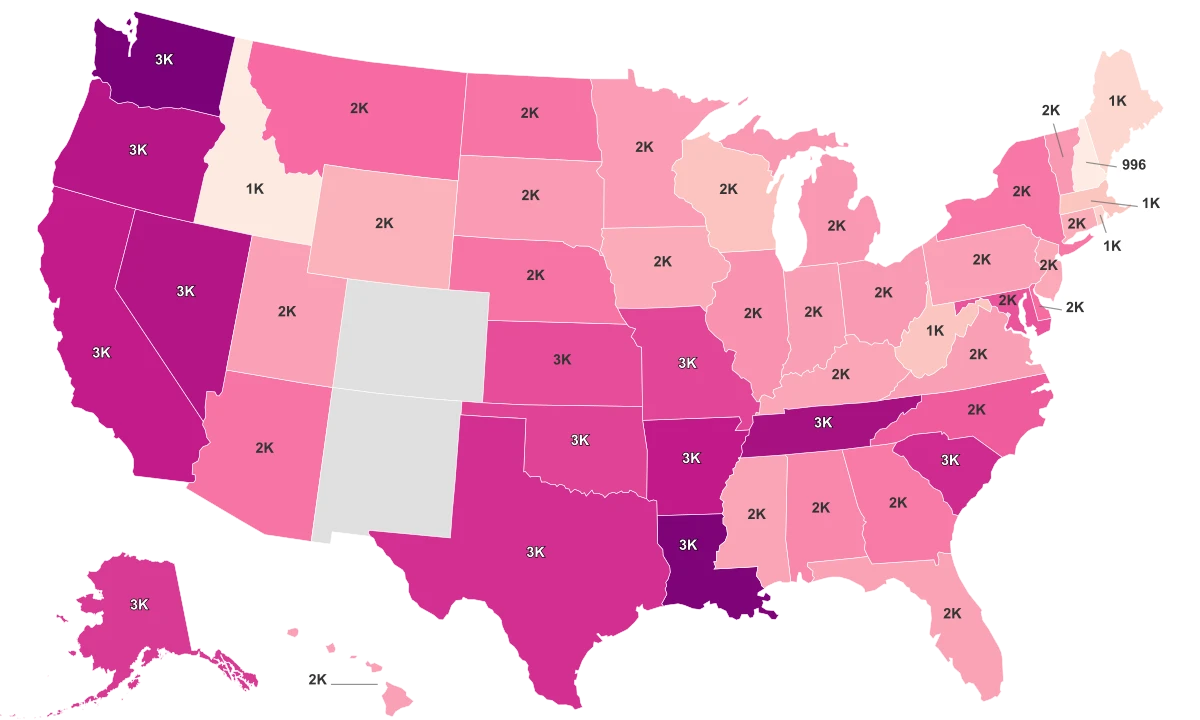
The most common assumption about recidivism is that states with high incarceration rates should have low return rates. If you lock up more people for longer, the thinking goes, fewer should come back. The data shows almost no relationship between the two.
Mississippi incarcerates more people per capita than any other state: 658 per 100,000 residents. Its recidivism rate is 35%, slightly above the national average. Oklahoma locks up 574 per 100,000, the fifth-highest rate in the country. Its recidivism rate is just 18%. Meanwhile, New Hampshire imprisons 148 per 100,000, one of the lowest rates nationally, yet nearly half of its released prisoners return within three years.
States That Imprison the Most Do Not See Fewer People Return
Recidivism Rate vs. Imprisonment Rate per 100,000 residents across all 50 states, showing virtually no relationship between how many people a state locks up and how many come back.
The regional pattern reinforces the disconnect. The South has the highest average imprisonment rate at 429 per 100,000 but the lowest average recidivism rate at 29.6%. The Northeast is the mirror image: the lowest imprisonment rate at 184 per 100,000 and the highest recidivism at 36.3%.
Part of the explanation is definitional. Many Southern states count only new convictions in their recidivism figures. Northeastern states more commonly count technical violations, which inflates the return rate without reflecting new criminal behavior. But part of it is structural. A state that incarcerates primarily low-risk offenders for long sentences may see fewer returns simply because those individuals were less likely to reoffend in the first place. The recidivism rate measures the behavior of whoever gets released, and who gets released is a policy choice, not a natural constant.
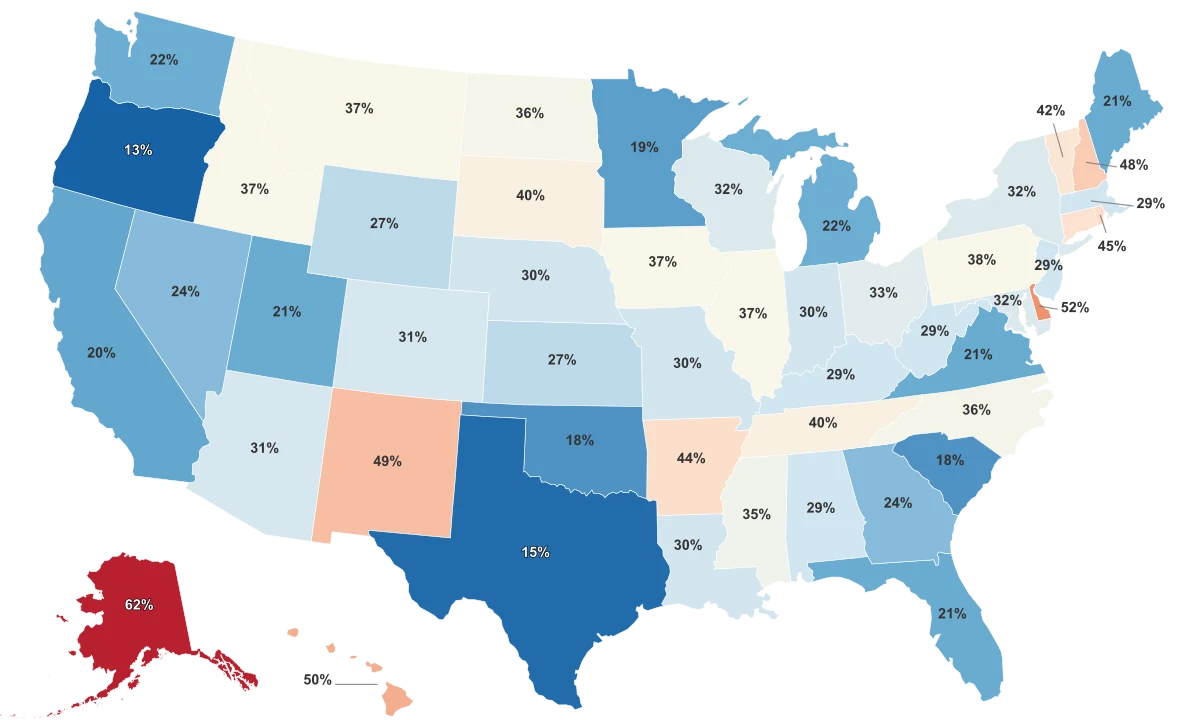
California Fell 42 Ranks. Here Is How.
No state in the dataset moved further or faster than California. In 2008, its recidivism rate was 64%, the third-highest in the country. By 2019, it had fallen to 20%, a 44-point drop that sent it from near the top of the rankings to 45th. That is a fall of 42 rank positions, more than double the next-largest mover.
The explanation is not one reform. It is three, stacked over five years. In 2011, the Public Safety Realignment Act (AB 109) shifted responsibility for thousands of low-level offenders from state prisons to county jails and probation. In 2014, Proposition 47 reclassified many drug possession and property crimes from felonies to misdemeanors. In 2016, Proposition 57 expanded parole eligibility for nonviolent offenders and created incentives for participating in rehabilitation programs.
The combined effect was a fundamental change in who enters and exits the state prison system. People who would have returned to a state facility now cycle through county-level supervision instead, and county returns are not captured in the state recidivism metric. Researchers at the California Policy Lab at UC Berkeley have noted that while the number of people returning to state prison dropped dramatically, rearrest and reconviction rates for some populations remained relatively stable during the initial years of Realignment.
That partial accounting helps explain a second paradox: California's reincarceration cost is $2.22 billion, the highest in the entire dataset by a wide margin. Even with far fewer people cycling back through state prison, the state's per-inmate costs are among the nation's highest, and the system still holds over 98,000 people. Fewer returns, enormous expense. The reform lowered the revolving door's speed, but it did not shrink the building.
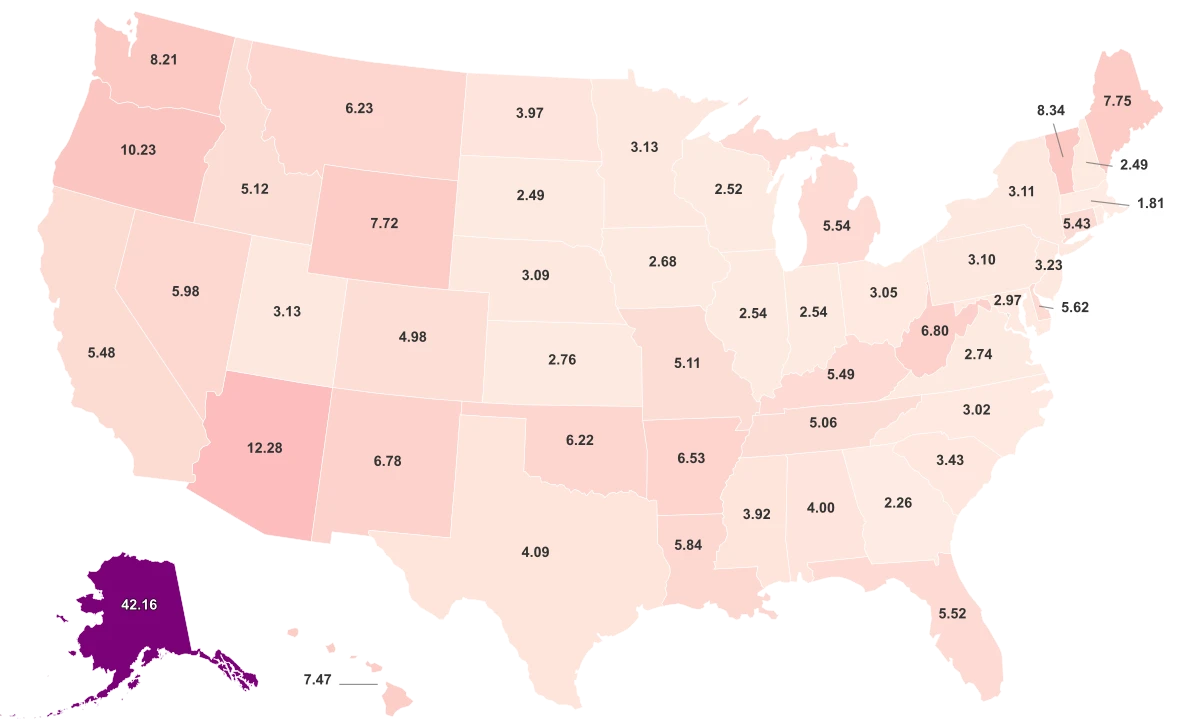
Alaska Is the Only True Outlier, and Geography Explains Most of It
Alaska is the only state whose recidivism rate qualifies as a true statistical outlier, sitting nearly three standard deviations above the national mean. At 62%, it is 10 percentage points higher than the next-closest state, Delaware at 52%. And unlike most states in the dataset, it barely moved over the decade: Alaska's 2008 rate was 66%, meaning its drop was just 4 points while the national average fell by closer to 8.
The structural barriers are uniquely Alaskan. Reentry services, from substance abuse treatment to transitional housing to employment programs, are concentrated almost entirely in Anchorage, Fairbanks, and Juneau. The Alaska Mental Health Trust Authority has documented that individuals released to rural or remote communities face some of the longest gaps between need and access of any state. A person leaving prison in a village reachable only by bush plane has fundamentally different reentry prospects than someone released into a city with public transit and a halfway house.
Substance use is a major driver. Alaska has one of the highest rates of substance use disorder in the country, and untreated addiction is the single strongest predictor of return to custody in most state corrections research. The state also incarcerates people at the second-highest rate per capita nationally: 626 per 100,000, another statistical outlier. Alaska Native populations are significantly overrepresented in the state's prison system and face additional barriers related to historical trauma, jurisdictional complexity, and limited access to culturally responsive treatment.
The combination of high imprisonment, high recidivism, and limited reentry infrastructure creates a cycle that no single policy intervention has been able to break. Regional reentry coalitions have expanded in recent years, but the fundamental geography of the state, thousands of communities spread across an area twice the size of Texas, makes building a statewide support network orders of magnitude more difficult than in any other state.
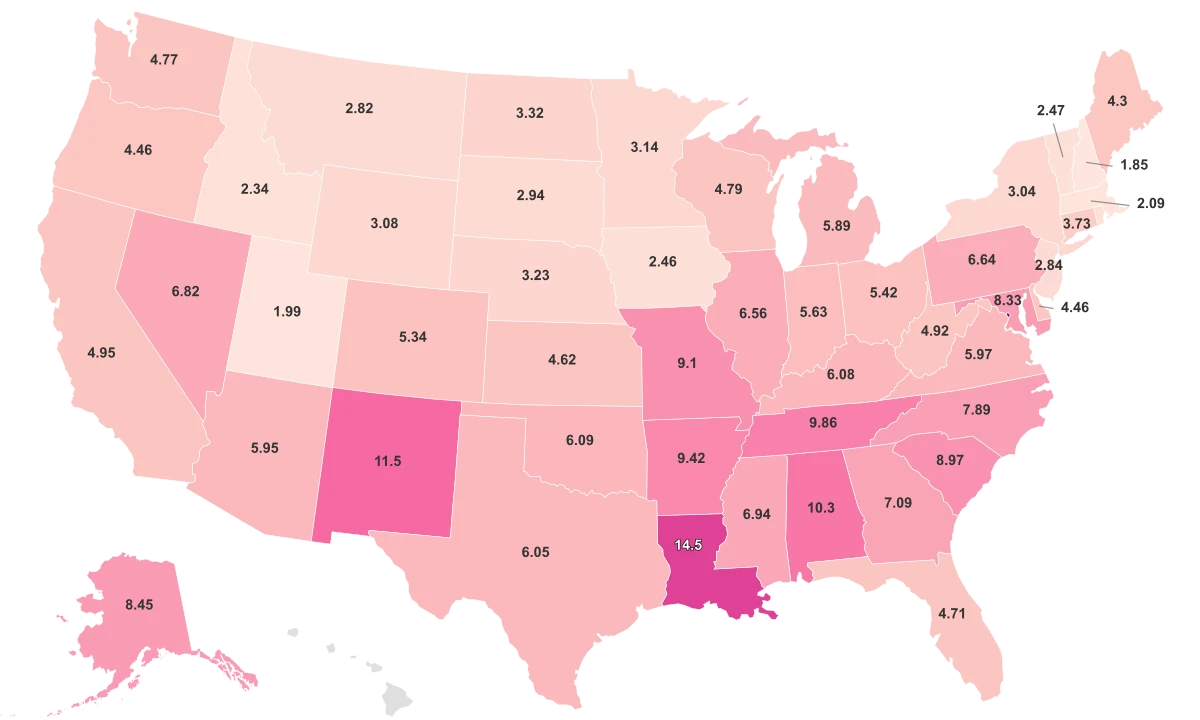
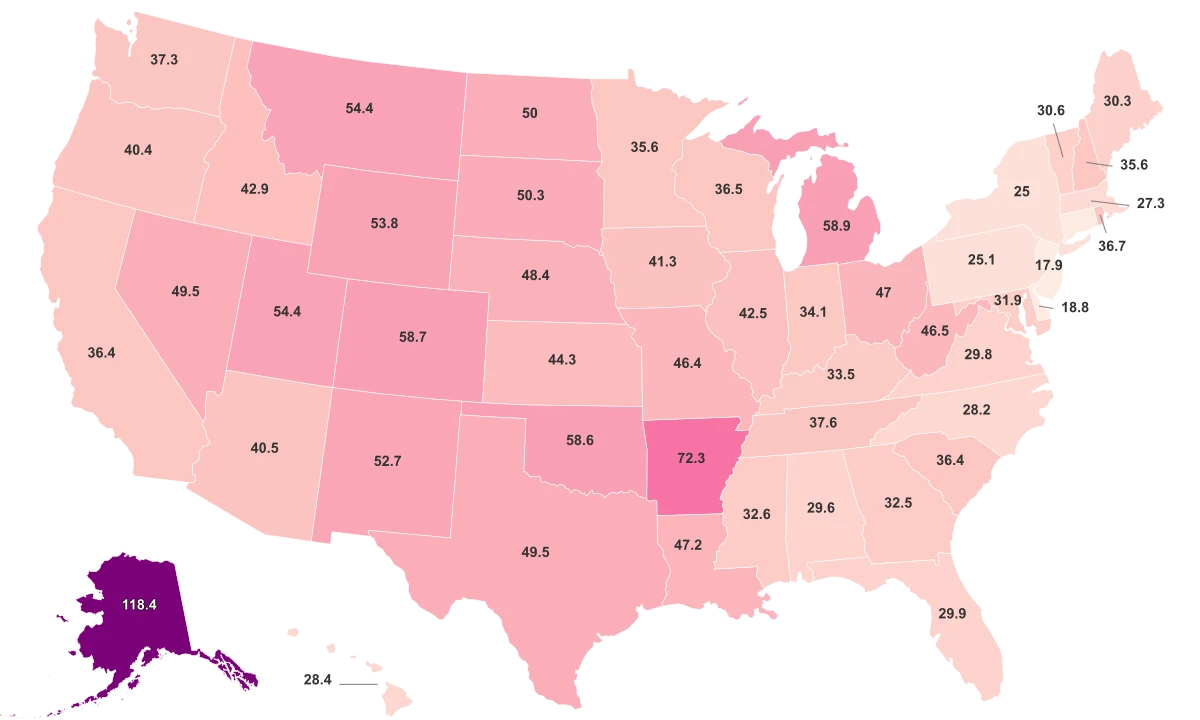
The Billion-Dollar Revolving Door
Recidivism is not just a public safety metric. It is a budget line. The CSG Justice Center estimated the taxpayer cost of reincarcerating people released in 2022 who are expected to return within three years, factoring in average length of stay and daily incarceration costs. The numbers are staggering.
California leads at $2.22 billion. Florida follows at $494 million, then New York at $433 million, Texas at $369 million, and Illinois at $367 million. Those five states alone account for well over half of the total national reincarceration bill. The concentration mirrors the prison population itself: Texas, California, Florida, Georgia, and Ohio hold 39% of all state prisoners in the country.
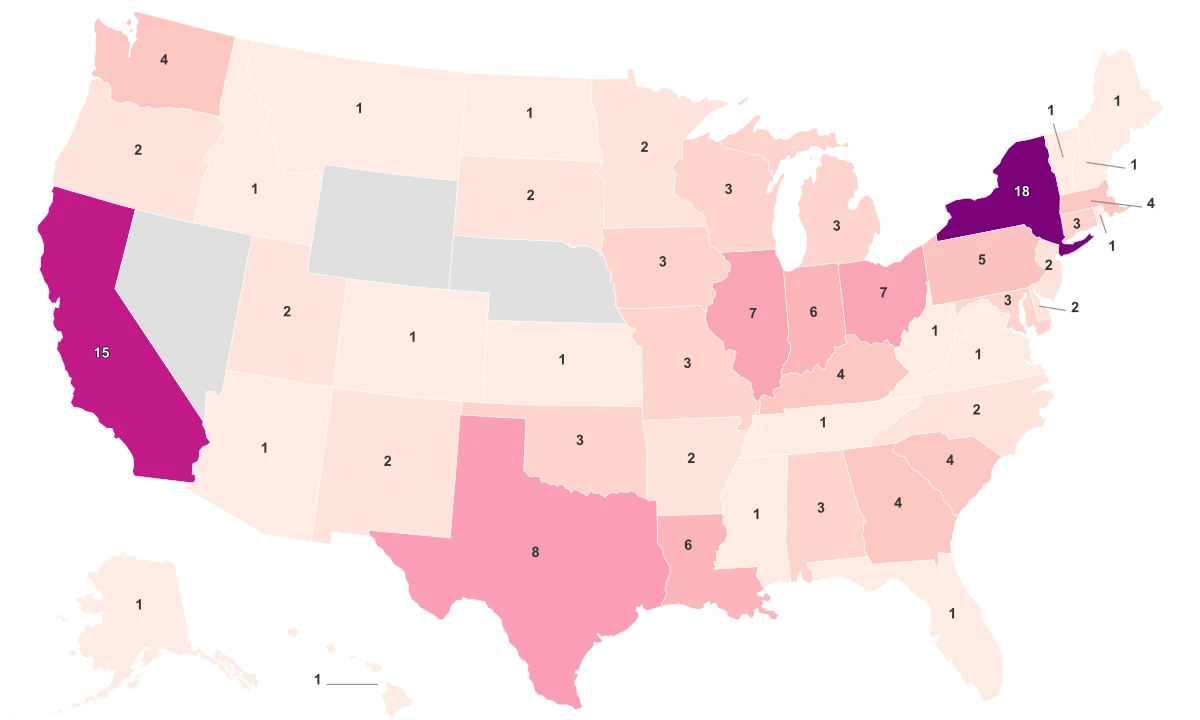
Most States Brought Their Recidivism Rates Down Over a Decade
Three-year reincarceration rate for 2008 vs. 2019 release cohorts. California's 44-point drop dominates, but most states saw meaningful declines.
But a falling recidivism rate does not always translate to falling costs. West Virginia has a moderate recidivism rate of 29% and a small prison population of about 4,650 people. Its reincarceration bill is $237 million, more than states with double or triple its population. The reason is per-diem cost: what it costs to house one person for one day varies dramatically by state, and high costs in smaller systems can dwarf the total spending of larger but cheaper ones.
The states that moved in the wrong direction stand out in the arrow chart. North Carolina climbed from 25% to 36%, an 11-point increase that vaulted it 26 rank positions. Iowa rose from 32% to 37%. New Hampshire went from 43% to 48%. These are not states that reformed and failed. They are states where the composition of who gets released, or how returns are counted, shifted in ways that pushed the number up. Whether the cause is policy, procedure, or genuine increases in reoffending varies. The data records the outcome. It does not always explain it.