
§ 03
Introduction
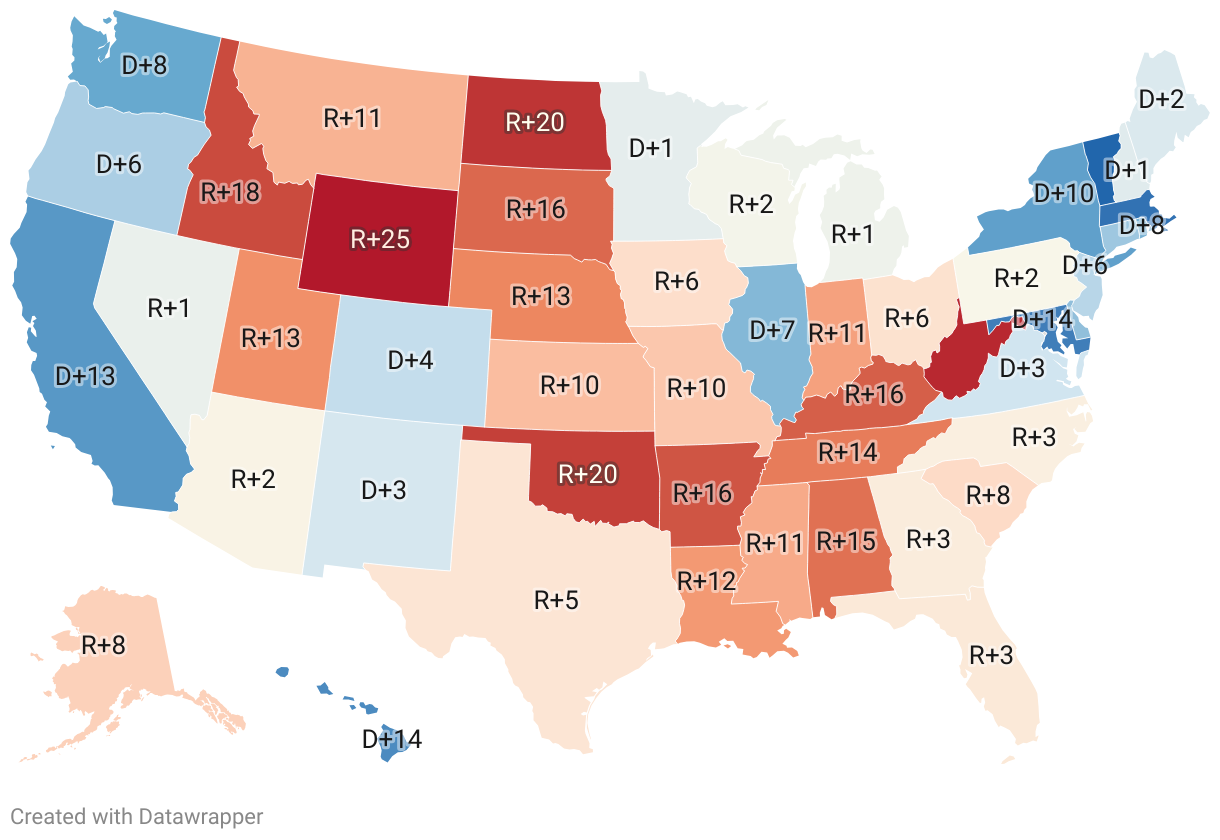
The geographic distribution of America's political affiliations, often color-coded as red, blue, and purple, provides critical insights into the ideological landscape of the United States. Since 2000, the terms “red state”, “blue state”, and “swing state” have become ingrained in our election lexicon, representing regions that tend to vote predominantly Republican, Democratic, or fluctuate between the two parties respectively in presidential and other statewide elections. Through adopting winner-take-all systems, states can appear uniformly red or blue despite population nuances. Yet, with a surge in polarisation, some states have sustained their partisan leaning for several election periods.
- States tend to lean more towards the Republican Party, with a total of 23 states identified as Republican, compared to 16 Democratic states, and 11 Swing States.
- There is a noticeable regional pattern. The West Coast, Northeast, and some Great Lakes states tend to lean Democratic, while the Central and Southeast regions lean more Republican- thus continuing the trend of an urban-rural divide.
- Swing states, which fluctuate between Republican and Democratic alignment, are interspersed throughout the nation but notably include competitive regions such as Florida, Pennsylvania, and North Carolina. These states often determine the outcome of national elections due to their volatile political leanings.
- Long-standing red states include traditionally conservative regions like Wyoming, Alabama, and Idaho, while steadfast blue states encompass archetypally liberal states such as California, New York, and Massachusetts.
- While some states like Alaska remain consistently Republican, others like Georgia have transitioned from a Republican stronghold to a Swing state, reflecting how demographic shifts and socio-political factors can change a state's political leaning over time.

