




















Key Takeaways
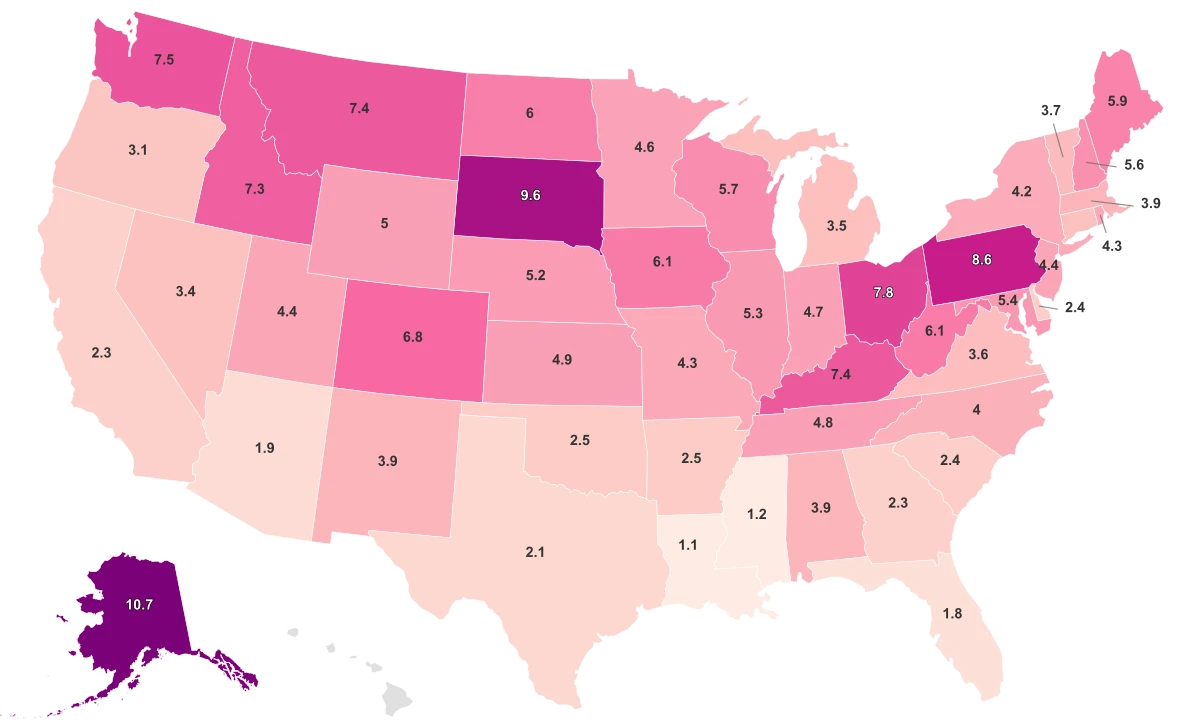
- Alaska has the highest average indoor radon in the country at 10.7 pCi/L, the only state in double digits.
- Louisiana sits lowest at 1.1 pCi/L, with Mississippi just above it at 1.2.
- That spread is nearly tenfold, and 29 of the 49 ranked states average at or above the EPA action level of 4.0 pCi/L.
- The pattern tracks geology, not behavior: uranium-rich bedrock and glacial soils push some states high, but radon is found in homes in every state, so no state average tells you what is in your own house.
What a Radon Map Actually Measures, and Who Tops It
Radon is an invisible, odorless radioactive gas that seeps up from soil and rock into the buildings above it, and it is measured in picocuries per liter of air, or pCi/L. On that scale, Alaska averages the most at 10.7 pCi/L, while Louisiana averages the least at 1.1, with Mississippi a hair above at 1.2. A higher number means more radon, and on a question this consequential, more is the direction you do not want.
These figures come from an aggregate of submitted radon test-kit results compiled by Air Chek, Inc., a private testing company, rather than from an official government survey. They are best read as a screening-grade snapshot of where radon tends to run high, not as a precise federal statistic, and the dataset carries no single collection year. It covers 49 states, with Hawaii and the District of Columbia absent.
The number that gives every other figure meaning is 4.0 pCi/L. That is the level at which the U.S. Environmental Protection Agency recommends taking action to reduce radon in a home, and it sits like a waterline across this entire ranking. Most states sit in the mid-single digits, a handful break far above the pack into the high single digits, and a cluster of southern and coastal states fall well below the line.
Most States Average Above the Line EPA Draws
The headline in this data is not the top state, it is how many states clear the EPA threshold. Of the 49 ranked states, 29 average at or above 4.0 pCi/L, the level where the EPA recommends fixing a home. That is close to 60 percent of the country sitting, on average, in the zone the agency flags for action.
It helps to know what that line actually is. The EPA's action level is not a bright boundary between safe and dangerous air. The agency is explicit that there is no known safe level of radon, and it recommends that people also consider reducing levels between 2 and 4 pCi/L. The 4.0 figure is the point at which mitigation is clearly worth doing, not a certificate that anything below it is harmless.
The stakes behind that line are why it exists. The EPA estimates that radon is the second leading cause of lung cancer in the United States, the leading cause among people who have never smoked, and is responsible for about 21,000 lung cancer deaths a year. A state averaging above 4.0 is not a verdict on any single household, but it is a signal that elevated readings are common enough there to take seriously.
Radon Is Written in the Bedrock, Not the Lifestyle
Why some states run high and others low has almost nothing to do with how people live and almost everything to do with what they live on top of. Grouped by region, the Midwest averages 5.64 pCi/L and the West 5.31, while the South averages just 3.34. The Midwest figure runs roughly two-thirds higher than the South's, a gap that maps cleanly onto the rocks below.
Radon is the decay product of uranium, so radon potential follows uranium in the ground. The U.S. Geological Survey links the highest indoor radon to "uraniferous metamorphosed sediments, volcanics, and granite intrusives," along with glacial soils derived from uranium-bearing rock. That description fits the granite-and-glacier belt of the northern Plains and Mountain West and the uranium-rich Appalachian spine far better than it fits the younger, low-uranium coastal sediments of the Gulf South, where Louisiana, Mississippi, and Florida sit near the bottom.
This is also why a related-sounding metric does not belong in the conversation. Outdoor air quality measures a different kind of pollution through a different pathway, and the states with the cleanest outdoor air are not the states with the least radon. Radon is a ground-up problem that collects indoors, which is exactly why where you stand on this map is set by geology rather than by anything happening in the sky.
Why Your State's Average Cannot Tell You About Your House
The most important thing this ranking can do is talk you out of trusting it too much. Alaska's average of 10.7 pCi/L sits about a full point clear of the next state and stands further from the pack than any other, which makes for a striking top of the table. But an average is built from homes that test very high and homes that test very low, and the spread within a single state dwarfs the differences between most states.
That is not a quirk of this dataset, it is the official position of the agency that maps radon. The EPA's own Map of Radon Zones, developed in 1993, carries a blunt disclaimer that it "should not be used to determine if individual homes need to be tested." The American Lung Association makes the same point from the other direction, noting that radon has been found in high amounts in homes in every state.
So the practical reading of this map is narrow. A low state average does not make a home safe, and a high one does not condemn it; the only number that describes your air is the one from a test of your own home. The EPA's guidance is the same everywhere on this ranking and does not change with it: no matter where you live, test your home for radon. It is the rare case where the data is genuinely interesting and the right response to it is identical for everyone who reads it.