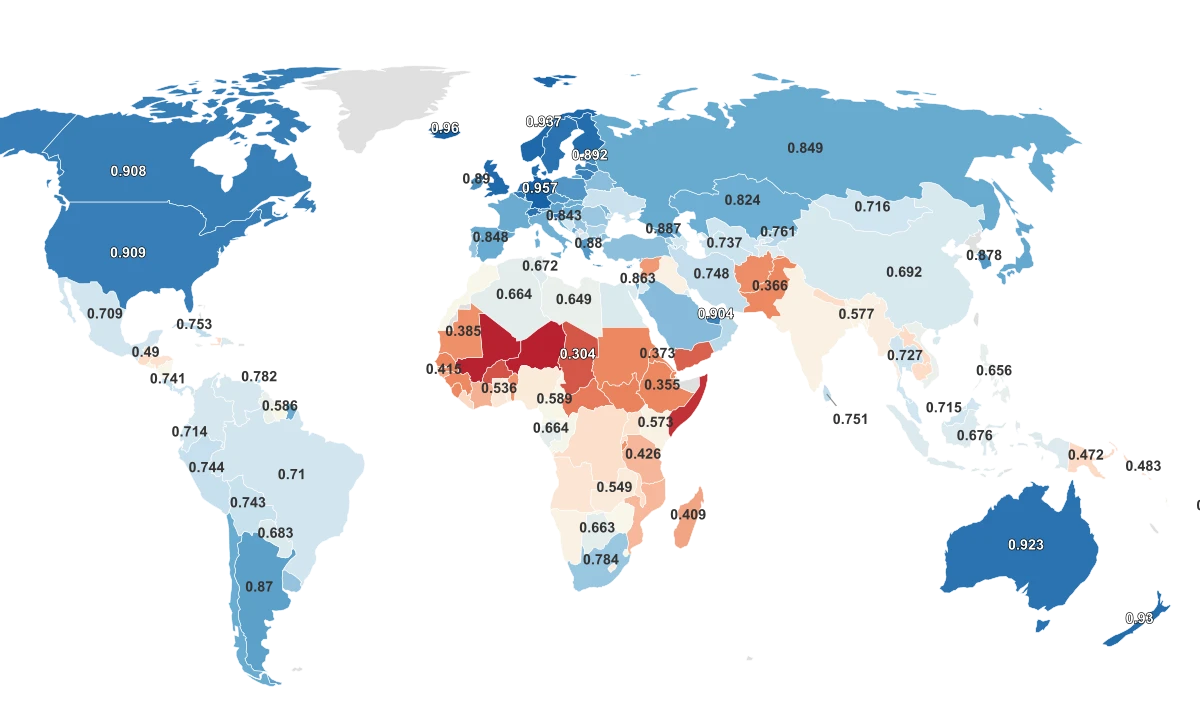
From Iceland to Niger, the Gap Spans Nearly a Decade of Schooling
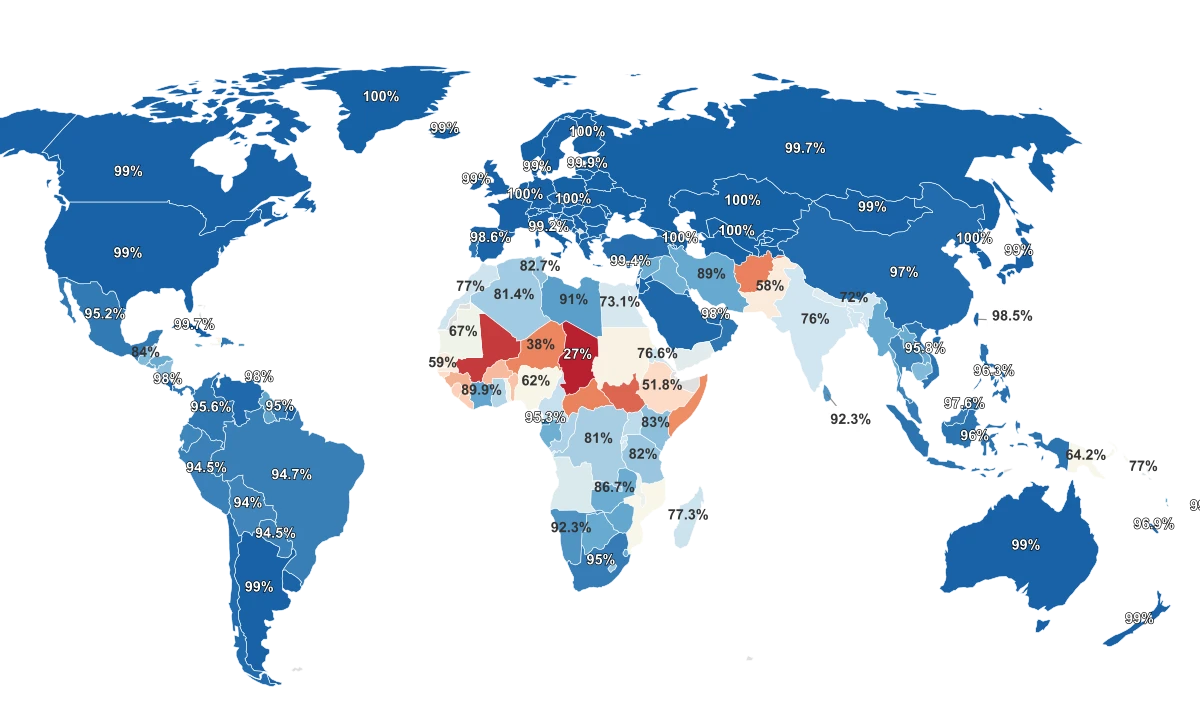
The United Nations Development Programme ranks countries on education using a single number called the Education Index. It combines two inputs: the average number of years adults have actually spent in school, and the number of years today's children can expect to attend. Both are normalized to a scale of 0 to 1, then averaged. The result is a snapshot of where a country stands in terms of educational access and attainment.
Iceland leads the world at 0.960. Germany sits just behind at 0.957, followed by Norway (0.937), the United Kingdom (0.936), and Denmark (0.933).
At the other end, Niger scores 0.243. Mali is just above it at 0.248, and Somalia at 0.274. The gap between first and last is 0.717.
In concrete terms, the difference is generational. Germany's adults average 14.3 years of schooling, enough to include a university education. Niger's adults average 1.4 years, roughly the equivalent of not finishing second grade. Six countries at the bottom of the Education Index are statistical outliers, sitting more than two standard deviations below the mean: Niger, Mali, Somalia, Burkina Faso, Chad, and Yemen. All six are in sub-Saharan Africa or the Middle East, and all share a common thread of prolonged conflict or extreme poverty.
Most countries cluster in the middle of the scale, bunched between roughly 0.55 and 0.80. Below that, a long tail of very low performers stretches toward the bottom. Above it, a tight group of Western European and Anglophone nations crowd the top. The extremes are dramatic, but the bulk of the world sits within a narrower band than the headline numbers suggest.
More School Does Not Mean Better School
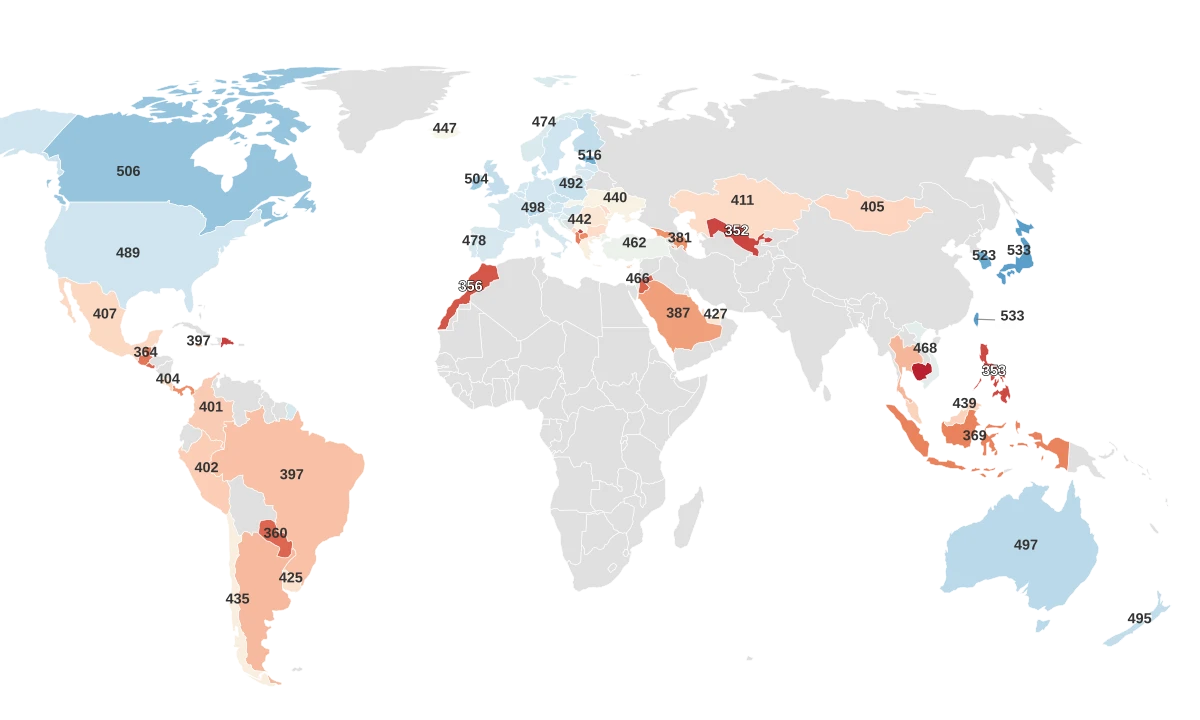
The Education Index rewards time in classrooms. It does not measure what happens inside them. That distinction reshapes the entire ranking when you compare it to the OECD's PISA assessment, which tests whether 15-year-olds can actually apply what they have learned.
Germany ranks 2nd on the Education Index at 0.957, the highest-scoring country that also participates in PISA. Its students score 482, which places them 24th out of 81 tested countries. Singapore ranks 30th on the Education Index with a score of 0.866 and only 12 mean years of schooling. Its students score 560 on PISA, the highest in the world. That is a 78-point gap, the equivalent of roughly two and a half years of schooling in the other direction.
The Best-Educated Countries Are Not Producing the Best Students
Education Index (quantity of schooling) vs. Overall PISA Score (quality of outcomes) for 78 countries. Singapore and Vietnam break far above the trendline.
Singapore's system was deliberately designed around this principle. In 2004, the Ministry of Education launched its "Teach Less, Learn More" initiative, shifting away from content coverage toward depth, problem-solving, and applied reasoning. Teachers are among the most competitively recruited professionals in the country. The results extend beyond test scores: even students in Singapore's bottom socioeconomic quartile exceed the overall OECD average, according to the 2022 PISA country report.
Vietnam is an even more dramatic example. With a mean of only 9 years of schooling and an Education Index of 0.647, Vietnam scores 468 on PISA. That is higher than the United Arab Emirates (427), Qatar (422), and Saudi Arabia (387), all of which have more than 10 mean years of schooling and vastly higher per-pupil spending. A World Bank study found that Vietnam gets more learning output per unit of educational input than almost any country in the dataset, a combination of cultural emphasis on academic effort, centralized quality standards, and remarkably low teacher absenteeism.
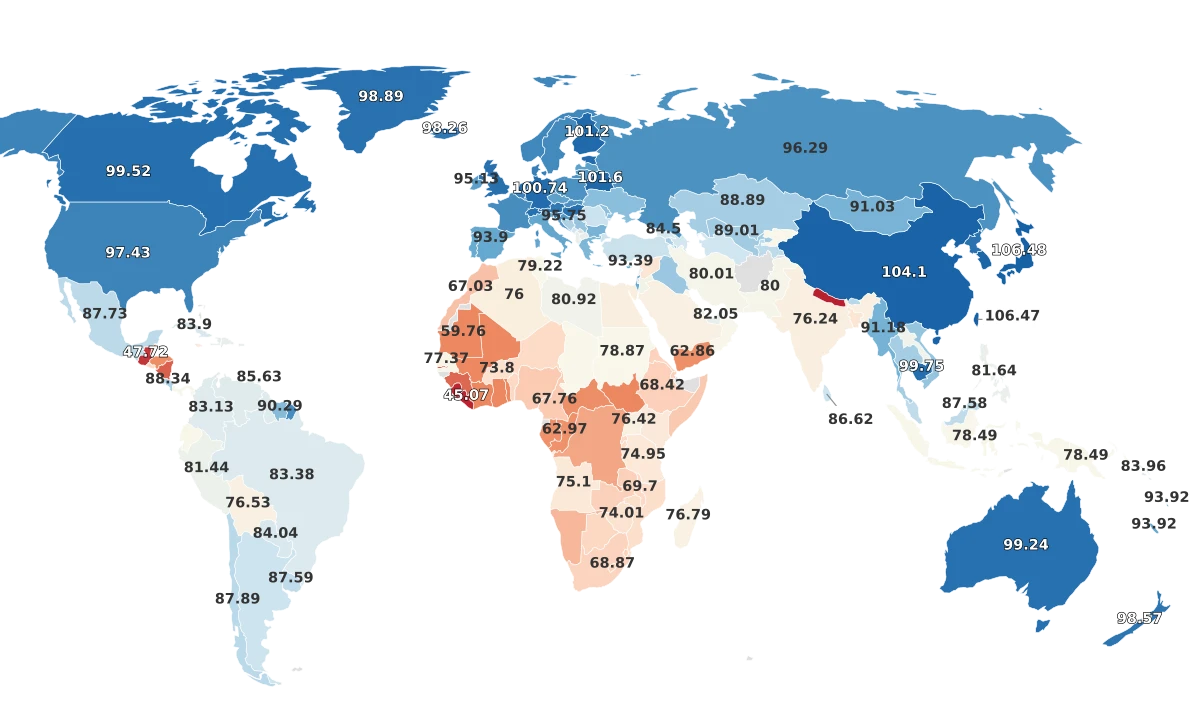
Inequality Makes Half the World's Progress Disappear
The standard Education Index is a national average. It treats a country where every adult finished 10 years of school the same as one where half the population finished 15 years and the other half finished 5. Those two countries are not the same, and the Inequality-adjusted Education Index exists to measure the difference.
The adjustment works by calculating how unevenly schooling is distributed across the population and then discounting the standard index accordingly. If access is perfectly equal, the adjusted score matches the standard one. If a small elite receives most of the education while the majority gets very little, the adjusted score drops.
Iceland loses almost nothing: its standard Education Index is 0.960, and its inequality-adjusted score is 0.942, a gap of just 2%. Germany loses 3.7%, going from 0.957 to 0.922. These are countries where the vast majority of the population completes secondary education.
The losses are far larger in the developing world. India has an Education Index of 0.570 but an inequality-adjusted score of just 0.348, a loss of nearly 39%. That gap means a substantial portion of India's population receives far less education than the average suggests. Pakistan shows a similar pattern: 0.366 drops to 0.221, a 40% loss. Morocco drops from 0.609 to 0.343, losing 43.6% of its score.
For South Asia and North Africa, the inequality gap is often the single largest drag on their overall human development rankings, according to the 2025 Human Development Report. The pattern is driven by gender: in countries where girls systematically receive fewer years of schooling than boys, the national average inflates what most of the population actually experiences.
Why the Bottom of the Rankings Stays the Bottom
The most striking feature of the bottom of this ranking is how persistent it is. The same countries appear at the bottom of the Education Index, at the bottom of Mean Years of Schooling, and at the bottom of the Inequality-adjusted Education Index. Niger, Mali, Somalia, Burkina Faso, and Chad are all statistical outliers on multiple metrics. The causes are structural, and they compound.
Armed conflict has shut down thousands of schools across the Sahel. In Mali and Niger, islamist insurgencies and military coups have driven mass displacement and made entire regions physically dangerous for students and teachers alike. According to VOA reporting on Sahelian school closures, thousands of schools remain closed in areas where armed groups have either destroyed facilities or threatened teachers who return. The result is that Mali averages just 1.6 years of adult schooling and Niger just 1.4.
Even where schools exist, poverty creates a competing economic logic. When a family cannot afford food, a child's labor has immediate economic value that schooling does not. A Brookings Institution analysis found that childhood poverty rates in sub-Saharan Africa are the single strongest predictor of low enrollment, stronger than teacher availability or school proximity.
Afghanistan (2.5 mean years) illustrates a different kind of barrier. The Taliban's ban on girls' secondary education, reimposed after the 2021 takeover, has effectively cut the country's educational capacity in half. The inequality-adjusted score for Afghanistan is just 0.210, meaning that even the already-low average dramatically overstates what most Afghans, particularly women, actually receive.
These numbers also carry a measurement caveat. In conflict zones, education data relies on household surveys and government reporting that may be incomplete or delayed. The UNDP acknowledges that estimates for countries like Somalia and South Sudan carry wider margins of uncertainty than those for stable, high-income nations. The patterns are real, but the precision of any single number should be read with that context.