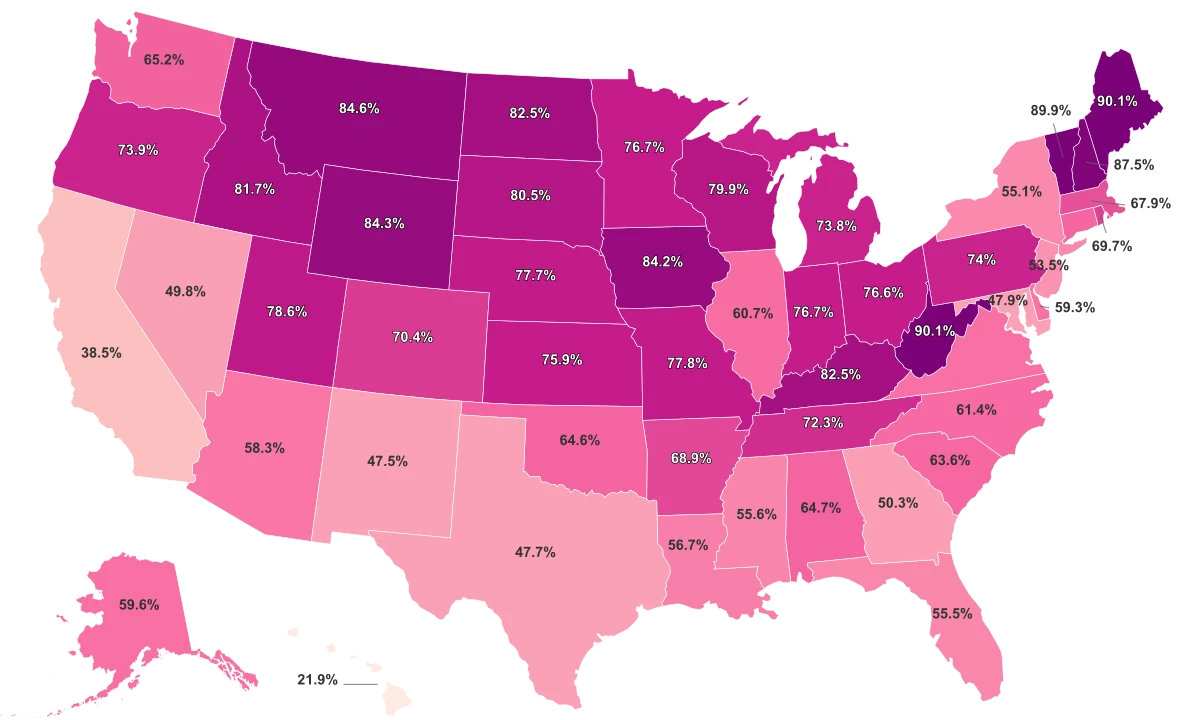
Maine, West Virginia, and Vermont Are All Above 89% White
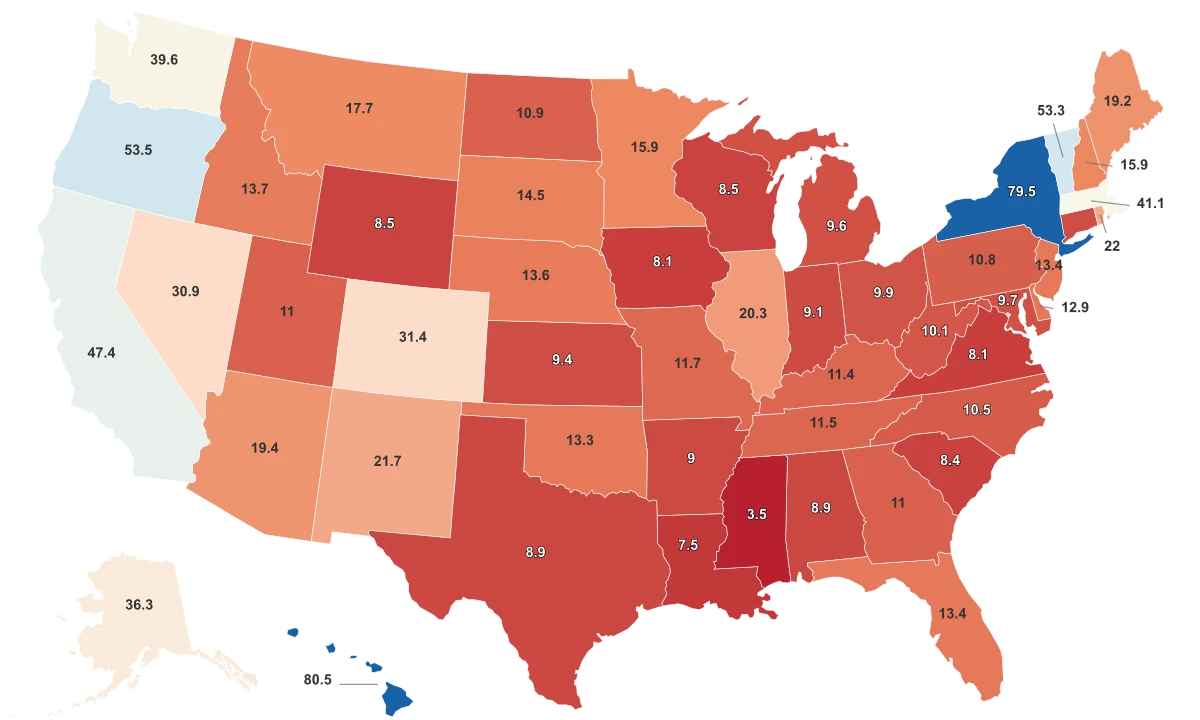
The whitest states in America are small, rural, and clustered in the northern corners of the country. According to the 2023 American Community Survey published by the U.S. Census Bureau, Maine and West Virginia share the top spot at 90.1% white alone. Vermont follows immediately behind at 89.9%.
The ranking measures "white alone," which counts only people who selected White as their sole racial identity on the Census form. It does not include people who selected White in combination with another race. That distinction matters, and the gap between the two measures varies dramatically by state.
Below Vermont, the rest of the top tier is similarly Northern and rural: New Hampshire at 87.5%, Montana at 84.6%, Wyoming at 84.3%, and Iowa at 84.2%. At the opposite end, Hawaii anchors the bottom at 21.9%. California sits second-to-last at 38.5%. New Mexico (47.5%), Texas (47.7%), and Maryland (47.9%) round out the five least white states.
Most states fall between 55% and 80%, with neither end of the spectrum dramatically outweighing the other. But the regional divide is sharp. The Midwest averages 76.9% white alone. The Northeast averages 72.5%. The West and South are nearly identical at 62.6% each. That 14-point gap between the Midwest and the other end of the country reflects patterns of settlement and migration that go back centuries.
The States at the Top Are Rural, Northern, and Geographically Isolated
The states that rank highest are not just white. They are places that, for structural reasons, were never exposed to the migration patterns that diversified the rest of the country.
Maine is the most rural state in the nation: roughly 61% of its population lives outside urban areas. Its earliest settlers came from Massachusetts and England, and its location in the far northeastern corner of the country, bordered only by New Hampshire and the Atlantic, limited subsequent immigration. During the Great Migration, when millions of Black Americans moved from the South to northern industrial cities, Maine had no industrial base large enough to serve as a destination. Its economy was built on forestry, fishing, and small-scale farming, not the factories and mills that drew diverse workers to cities like Detroit, Chicago, and Philadelphia.
West Virginia tells a parallel story through a different geography. The Appalachian Mountains isolated the region from the plantation economy that shaped the rest of Virginia. By 1860, enslaved people made up only 4% of the population in the territory that would become West Virginia. The coal industry attracted some European immigrants and Black workers from the South in the early 20th century, but when coal declined, so did the population. West Virginia has experienced net out-migration for decades. The people who left tended to be younger and more diverse, reinforcing the state's homogeneity over time.
The Midwest's position at the top of the regional averages follows a similar logic. States like Iowa, North Dakota, Wisconsin, and Nebraska were settled predominantly by Scandinavian and German immigrants in the 19th century. They lacked major port cities or industrial hubs that later drew immigrants from Latin America, Asia, and the Caribbean. Their agricultural economies required fewer workers than manufacturing, and their distance from the southern border limited Hispanic immigration relative to the West and Southwest.
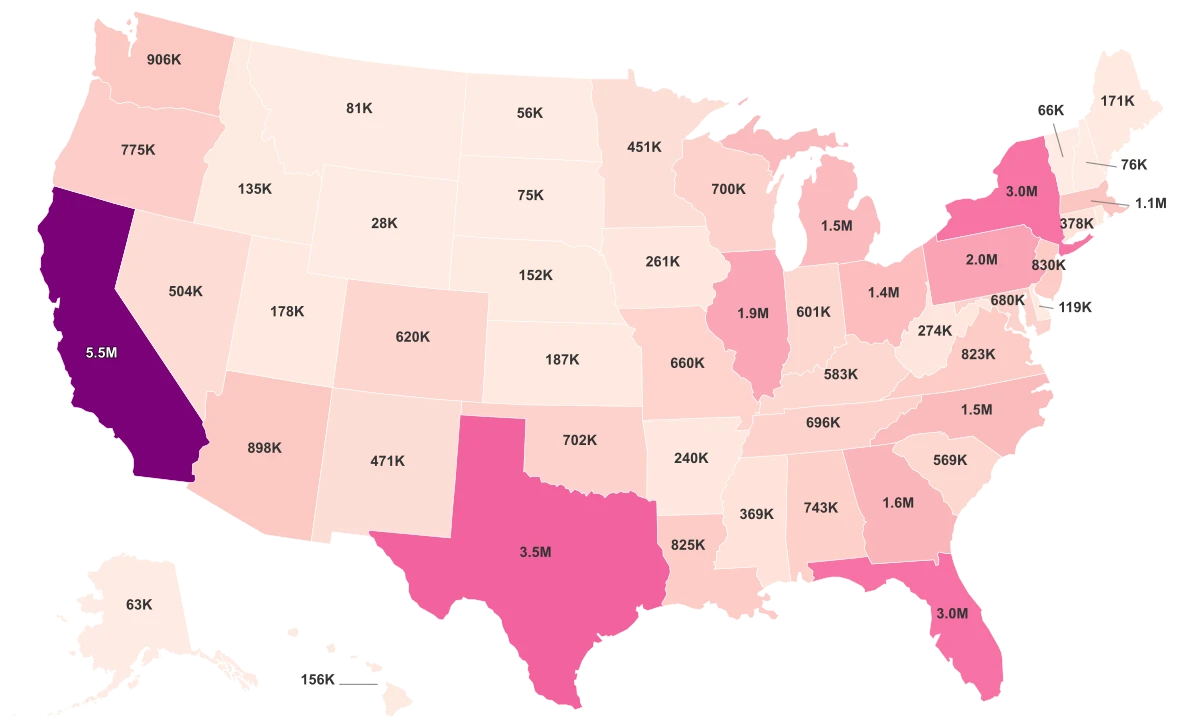
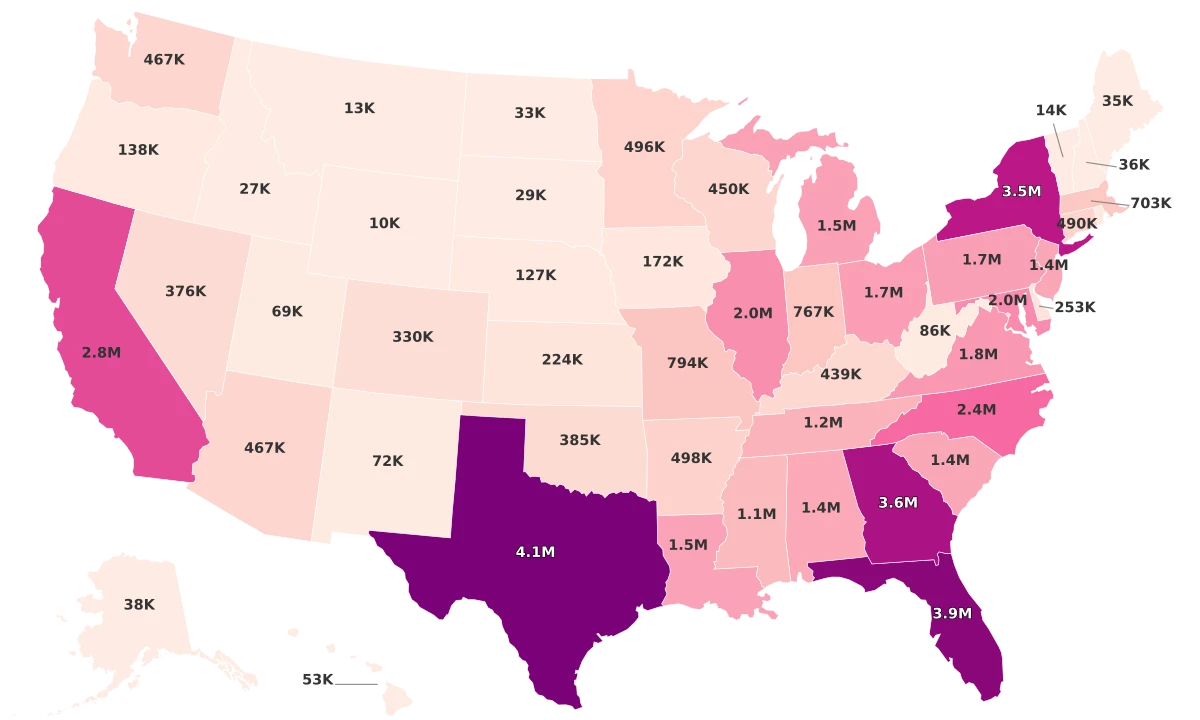
California Has More White Residents Than Any Other State. It Is Also One of the Least White.
The states with the most white people are, counterintuitively, among the least white by percentage. This is the clearest pattern in the data and the one most likely to surprise readers scanning the table.
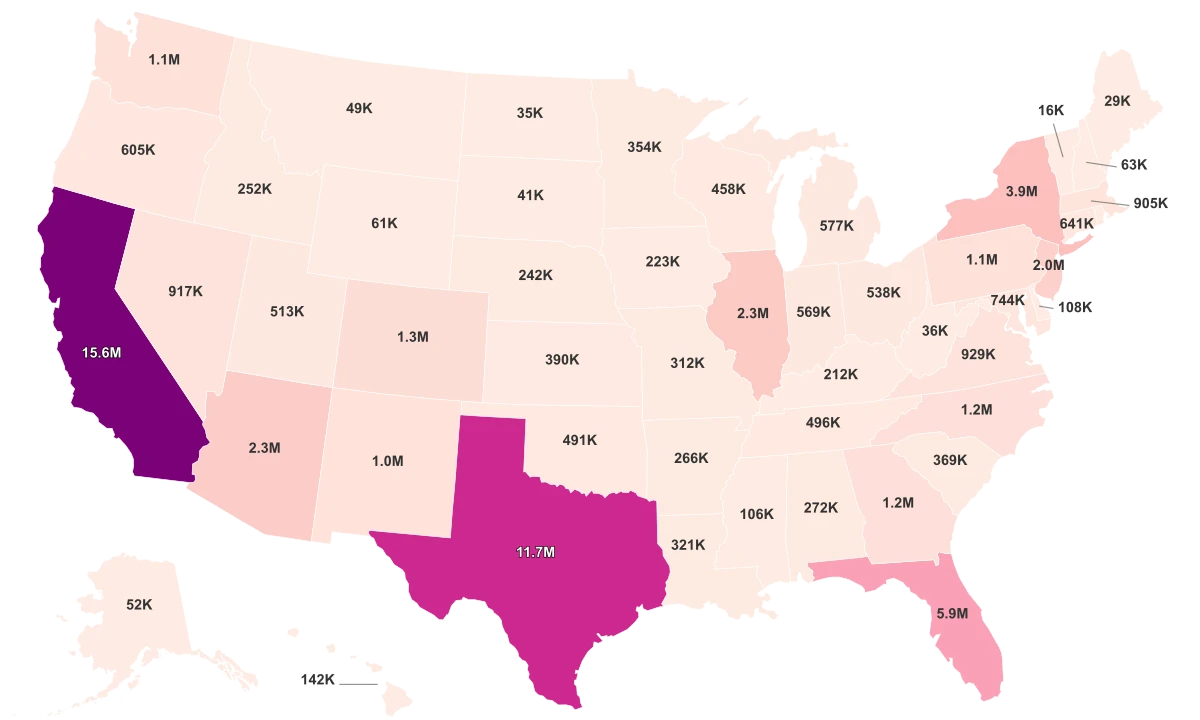
California has roughly 15 million residents who identify as white alone, more than any other state. Texas is second at 14.6 million. Florida follows at 12.5 million, then New York at 10.8 million and Pennsylvania at 9.6 million. Together, these five states account for 30.9% of all white Americans.
But in percentage terms, none of them except Pennsylvania (74%) crack the top half of the ranking. California sits near the bottom at 38.5%. Texas is at 47.7%. The explanation is straightforward: these are the most populous states in the country, and their population growth over the past half-century has been driven overwhelmingly by non-white residents.
California's white share has dropped from 76.3% in 1970 to 38.5% in 2023, one of the steepest demographic shifts of any state. Between 2010 and 2020, the Texas state demographer reported that 95.3% of the state's population growth came from minority populations. In 2023, Latinos officially became the largest demographic group in Texas, surpassing the non-Hispanic white population.
The pattern is not about white people leaving. It is about who is arriving and who is being born. Immigration, birth rate differentials, and domestic migration into Sun Belt states have all contributed to a demographic landscape where the states that contain the most white residents are also the states where those residents are the smallest share of the total.
Hawaii Has Never Had a White Majority
Hawaii is the only state in the dataset where white residents, by any measure, are a clear minority. At 21.9% white alone, it sits more than 16 percentage points below the next-lowest state. But even the broader "total white" measure, which includes multiracial individuals who selected white among other races, only reaches 44.3%. That 22.4 percentage-point gap between the two measures is the largest of any state and reflects Hawaii's extraordinary multiracial demographics.
The reason is historical. When American sugar planters expanded operations across the islands in the mid-1800s, they recruited laborers from China, Japan, Korea, and the Philippines. The influx was massive. By 1893, according to Pew Research Center, Chinese and Japanese male workers alone constituted 51.9% of Hawaii's population. Many stayed, married, and built families. Today, Asian Americans and Pacific Islanders collectively make up roughly 51% of the state's residents.
Hawaii's multiracial identification rate is eight times the national average. This is why the gap between white alone and total white is so wide: a substantial share of Hawaii's population identifies as white in combination with Native Hawaiian, Asian, or Pacific Islander heritage, rather than white alone.
Oklahoma shows a smaller but structurally similar pattern. Its white alone percentage is 64.6%, but its total white figure is 78.8%, a 14.2-point gap. The difference is largely explained by mixed white and Native American identification: Oklahoma has one of the largest Native American populations in the country, and intermarriage across that line has been common for generations.
What "White Alone" Actually Means in Census Data
The Census Bureau defines "White" as people with origins in Europe, the Middle East, or North Africa. That definition includes both Hispanic and non-Hispanic individuals, though demographic reporting often distinguishes between the two. A person who identifies as Hispanic and white simultaneously is counted in the "white alone" numbers in this dataset.
The more significant caveat is a measurement one. In 2020, the Census Bureau overhauled how it processes race responses. It expanded the write-in character limit from 30 to 200 characters, began coding up to six race groups per response field instead of two, and broadened its code lists for detailed racial categories. The practical effect was dramatic: identification as Two or More Races surged by 276% between 2010 and 2020.
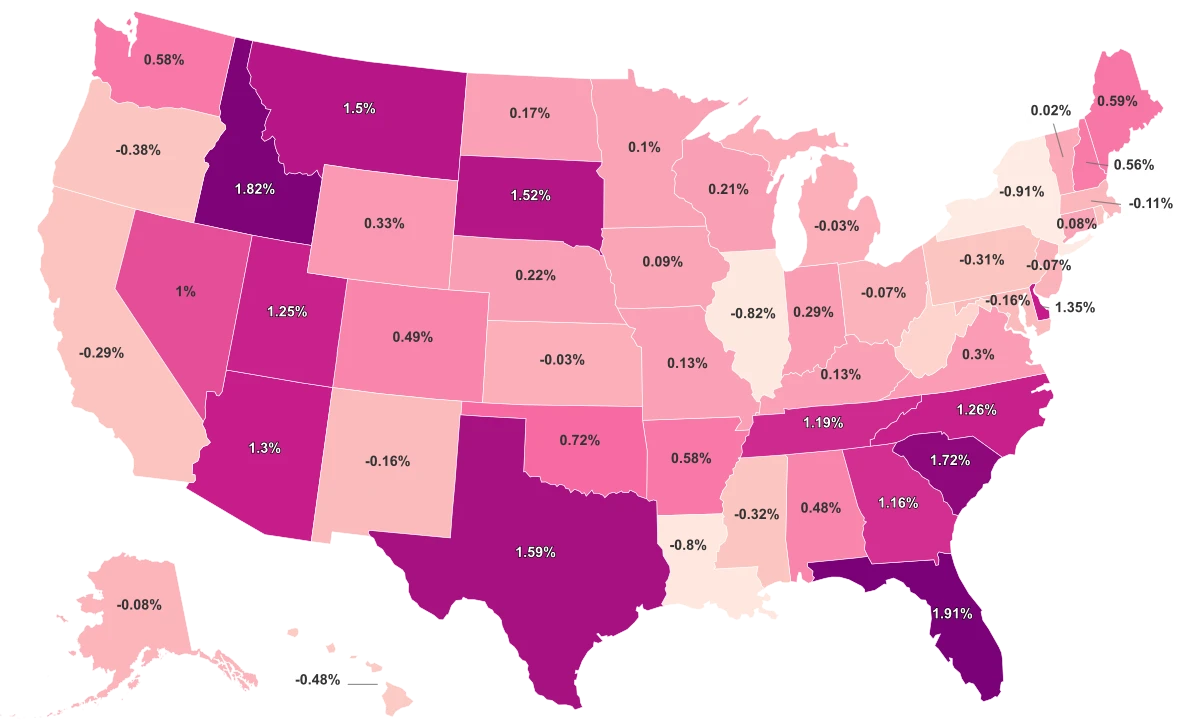
That surge came directly at the expense of single-race categories, especially white alone. The national white-alone population count fell by 8.6% between 2010 and 2020, the first absolute decline ever recorded. But the Census Bureau has cautioned that much of this shift reflects improved data collection, not an actual population change. People who previously checked only "White" are now providing more detailed, multiracial responses because the form makes it easier to do so.
The broader trend is still real. The non-Hispanic white share of the U.S. population fell from 63.7% in 2010 to 57.8% in 2020, the first time it dropped below 60%. According to the Brookings Institution, all of the nation's population growth between 2010 and 2020 came from people of color: the Hispanic population grew 23%, the Asian-alone population grew over 35%, and the multiracial population nearly quadrupled. The "whitest states" still sit well above the national average, but the national average itself is shifting beneath them.