The Gap Between Tallest and Shortest Is Nearly a Foot
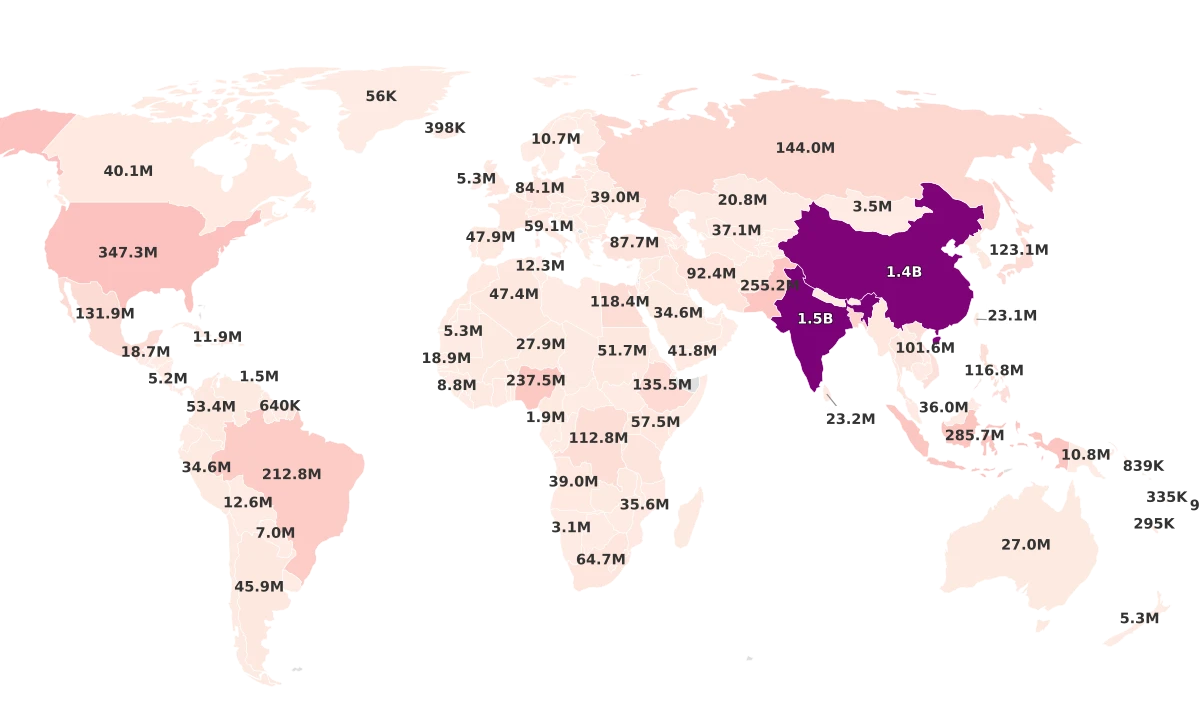
The numbers in this ranking come from one of the largest human growth studies ever conducted. Published in The Lancet in 2020, the NCD Risk Factor Collaboration pooled 2,181 population-based studies covering 65 million participants across 200 countries and territories from 1985 to 2019. The heights represent average 19-year-olds, the age by which most people have reached their full adult stature.
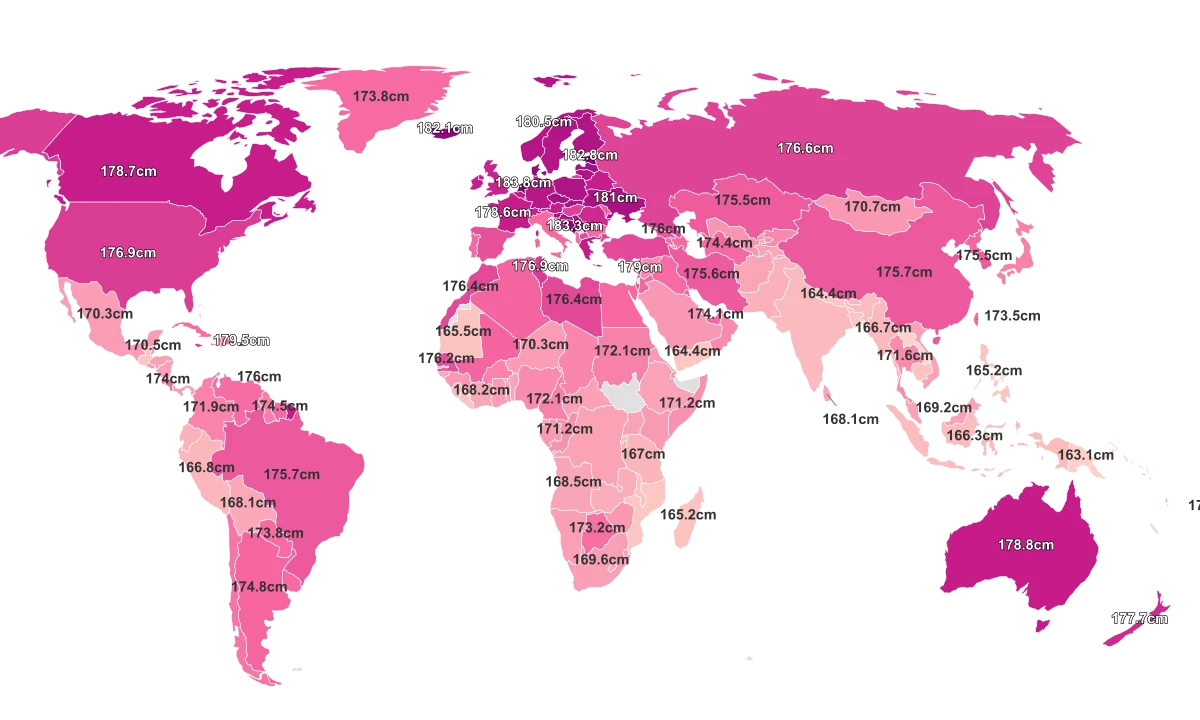
Netherlands leads the world at 183.8 cm for males, roughly six feet tall. Timor Leste sits at the other end at 160.1 cm, about 5 feet 3 inches. The gap between them is 23.7 centimeters, close to the length of a standard ruler.
For women, the spread is nearly as wide. The Netherlands tops the female rankings at 170.4 cm. Guatemala anchors the bottom at 150.9 cm, a difference of 19.5 centimeters.
The distribution is remarkably even. The global mean for males is 173.1 cm and the median is 173.5 cm, meaning there is no dramatic skew toward the top or bottom. Most countries cluster within a few centimeters of the middle. The outliers sit at both extremes: Northern and Southeastern Europe dominate the top tier, while South Asia, Southeast Asia, and parts of Central America anchor the bottom.
Why the Dutch Grew Taller Than Everyone Else
The Dutch were not always the tallest people in the world. In the 18th century, the average Dutchman was relatively short by European standards. The transformation happened over roughly 150 years, and it tracks with three reinforcing forces: nutrition, healthcare, and an unusual twist of natural selection.
The Netherlands has one of the highest per-capita dairy consumption rates in the world. Milk, cheese, and yogurt are dietary staples, and they deliver exactly what growing bones need: calcium and protein. That dietary foundation sits on top of a comprehensive welfare state that has provided universal healthcare, strong maternal care, and childhood nutrition programs since the mid-20th century. Dutch children rarely face the chronic infections and nutritional deficits that stunt growth elsewhere.
A widely cited study from the London School of Hygiene & Tropical Medicine found evidence that natural selection may also be at work. Taller Dutch men, on average, had more surviving children than shorter men over several generations. That reproductive advantage meant taller genes were passed on at higher rates than in populations where height conferred no fertility benefit. The researchers noted this pattern was stronger in the Netherlands than in other countries studied.
Montenegro (183.3 cm) sits just half a centimeter behind the Netherlands, and the Balkans as a region punch well above their economic weight. Bosnia and Herzegovina (182.5 cm), Croatia (180.8 cm), and Serbia (180.7 cm) all land in the top 15 despite having far smaller economies than Western Europe.
Northern Europe fills out the rest of the top tier. Estonia (182.8 cm), Iceland (182.1 cm), and Denmark (181.9 cm) sit within two centimeters of the Dutch. The common thread across these populations is not wealth. It is that they have had access to adequate protein and healthcare during the critical childhood growth window for at least two to three generations.
Malnutrition Writes the Bottom of the Rankings
The bottom of this ranking is not a genetic map. It is a nutrition map. Timor Leste (160.1 cm for males) sits farther below the global mean than any other country, more than 13 cm shorter than the average. Laos (162.8 cm), Papua New Guinea (163.1 cm), and Solomon Islands (163.1 cm) cluster just above it. The shared driver across these countries is chronic childhood malnutrition and stunting, defined by the World Health Organization as a height-for-age measurement more than two standard deviations below the growth reference median.
The starkest case is Guatemala, which anchors the very bottom of the female rankings at 150.9 cm. According to the World Bank and UNICEF, nearly half of all Guatemalan children under five suffer from chronic malnutrition. In rural indigenous Mayan communities, that figure climbs to 70 to 80 percent. These children do not lack the genetic potential to grow taller. They lack the calories, protein, clean water, and healthcare to reach it.
The most decisive evidence comes from biological anthropologist Barry Bogin, whose research tracked Guatemalan Mayan families who migrated to the United States. Their children, raised with better nutrition and sanitation, grew several inches taller than peers who remained in Guatemala. The genes were the same. The environment was not.
In South Asia, the pattern repeats. Bangladesh averages 165.1 cm for males. Nepal is close behind at 164.4 cm. India, the region's largest country, averages 166.5 cm. All three fall well below the global mean. These countries share high rates of childhood undernutrition and limited access to animal-source protein during the critical first 1,000 days of life, from conception through age two.
South Korea Proves Height Is Not Fixed
If average height were primarily determined by genetics, population rankings would barely change over time. They have changed dramatically. The most striking example is South Korea. A landmark study published in eLife found that South Korean women gained approximately 20.2 centimeters in average height between 1914 and 2014, the largest increase recorded for any population in the world over that period.
South Korean males in this dataset average 175.5 cm, placing the country in the middle of the pack globally but well above most of East Asia. A century ago, Koreans were among the shortest populations in their region. The transformation tracks almost exactly with the country's economic rise from one of the world's poorest nations after the Korean War to a high-income economy, bringing with it better food, cleaner water, and modern healthcare.
The contrast with North Korea is instructive. North Korean males average 174.7 cm, just 0.8 cm shorter than their southern neighbors. The populations share a common genetic ancestry, but decades of economic divergence have begun to separate them. The gap is modest so far, but ongoing nutritional deficits in North Korea suggest it may widen in future measurements.
Japan (172.1 cm) tells a related but different story. Japanese heights surged after World War II as the economy boomed and diets shifted toward greater protein intake. But that growth has largely plateaued since the 1990s, and Japanese males now sit below both South Korea and China (175.7 cm). China's average has climbed rapidly as economic development reached rural populations, and Chinese 19-year-olds are now taller than the global mean. None of these rankings are permanent. They are snapshots of how well each country is feeding and caring for its children right now.