From Hong Kong to Somalia, the Entire IQ Gap Is Just 24 Points
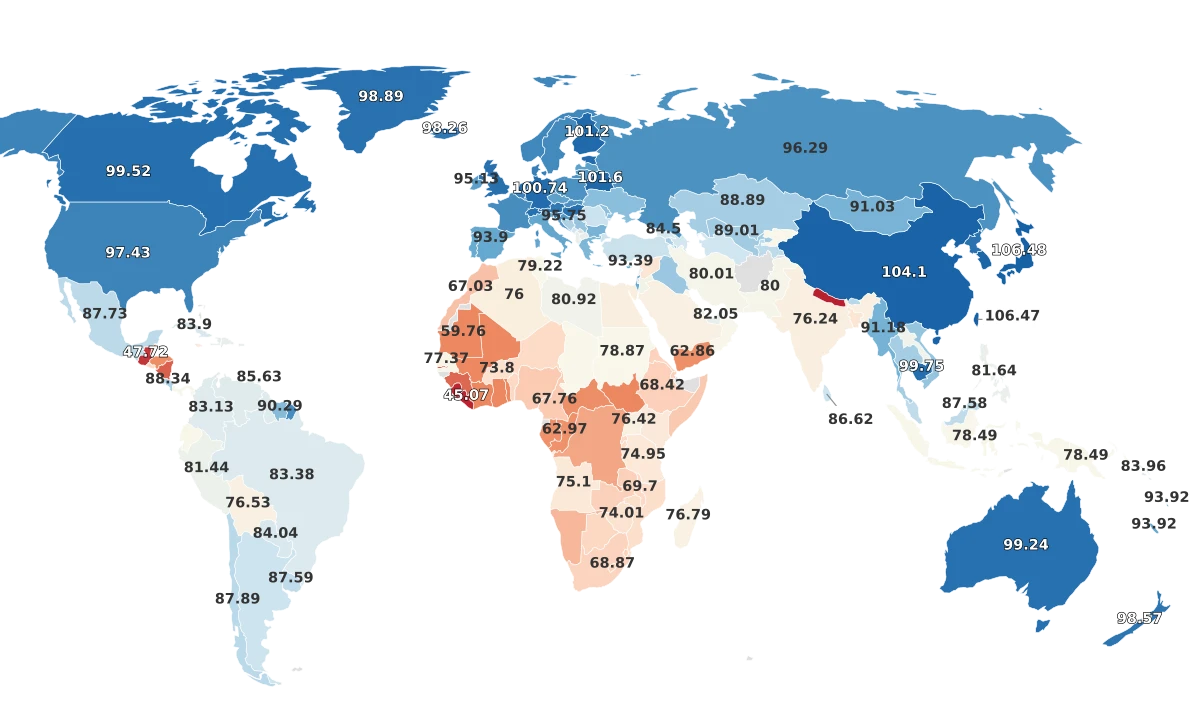
Most people expect the IQ gap between the top and bottom of this ranking to be enormous. It is not. The entire spread from first to last, across 143 countries, is 23.89 points: roughly one and a half standard deviations on a test normed to a mean of 100.
The data comes from the International IQ Test, an online assessment taken by over 1.2 million people in 2025. Every test-taker completed the same instrument, which eliminates the comparability problem that plagued older national IQ datasets. The test is normed to a mean of 100 with a standard deviation of 15.
Hong Kong leads at 107.73. Somalia sits at the bottom at 83.84. But the middle is remarkably compressed. Most countries cluster between 93 and 102, packed so tightly that a few points in either direction can move a country dozens of spots. The dramatic differences that some people imagine between nations simply do not show up in the data.
That said, the top of the ranking tells a clear geographic story. Every one of the five statistical outliers in the dataset is in East Asia.
Why East Asia Leads Every IQ Ranking
Hong Kong (107.73), South Korea (106.97), China (106.48), Japan (106.35), Macau (106.32), and Taiwan (105.84) form a cluster that sits well above the rest of the world. No country outside this group breaks 105. The next-closest performer, Iran at 104.8, is still more than a full point behind.
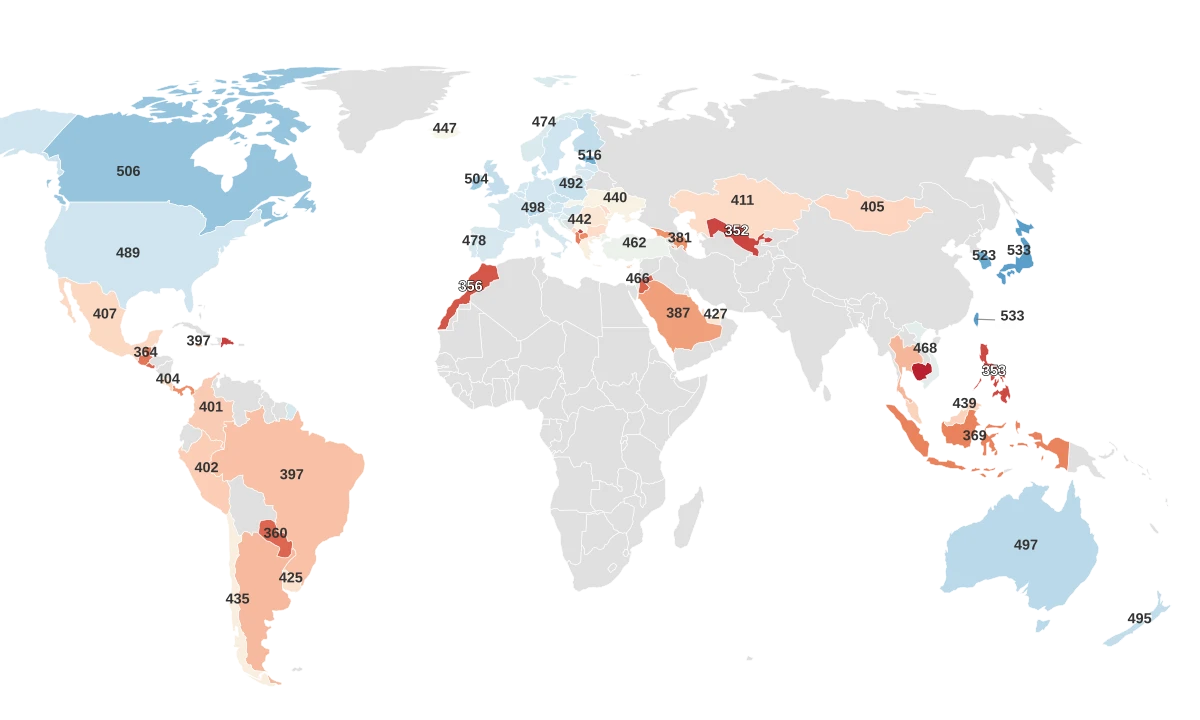
This pattern is not unique to IQ tests. It shows up in virtually every international cognitive assessment. On the 2022 PISA exam, administered by the OECD to 15-year-olds in 81 countries, Singapore scored 560, Japan 533, and South Korea 527. The IQ rankings and PISA rankings track closely across the dataset.
The structural reasons are well documented. East Asian education systems are among the most intensive in the world. In South Korea, the after-school tutoring industry known as the hagwon system enrolls roughly three out of four students. Japanese juku cram schools serve a similar function: over 60% of middle schoolers attend. These systems don't just extend the school day. They specifically drill the cognitive skills that standardized tests measure: pattern recognition, working memory, and timed problem-solving.
The cultural context matters as much as the structural one. Confucian values, shared across China, Korea, Japan, and Taiwan, place academic effort at the center of personal and family identity. Researchers have noted that this creates a cultural feedback loop: students study longer, perform better on assessments, and those results reinforce the belief that effort, not innate gifts, drives outcomes.
Education Doesn't Just Correlate With IQ. It Raises It.
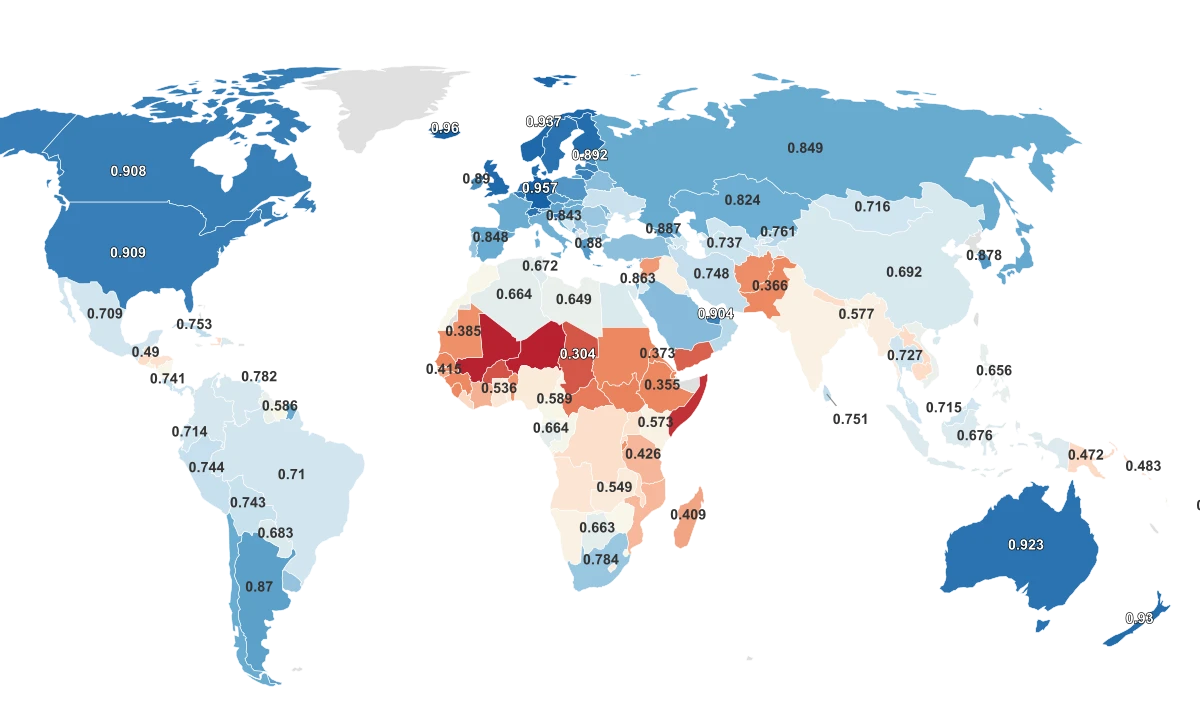
The relationship between IQ scores and education is not a mystery. Across 138 countries where both metrics are available, Average IQ and the UNDP's Education Index track together closely.
Countries With Stronger Education Systems Score Higher on IQ Tests
Average IQ rises in step with the Education Index across 138 countries, reinforcing that these scores reflect schooling more than innate ability.
A 2018 meta-analysis by Stuart Ritchie and Elliot Tucker-Drob, published in Psychological Science and covering over 600,000 participants, found that each additional year of formal schooling raises a person's measured IQ by 1 to 5 points. Education does not just correlate with IQ. It directly moves the score.
This is the core insight behind the Flynn effect, the well-documented phenomenon of rising IQ scores across generations. Average scores have climbed roughly 3 points per decade throughout the 20th century in countries with expanding education and improving nutrition. When schools get better, IQ scores go up. When they don't, they stagnate.
Nutrition plays a parallel role, especially in early childhood. According to UNICEF, iodine deficiency alone can lower a child's IQ by 8 to 12.5 points, and roughly 19 million babies remain at risk each year. Universal salt iodization, which costs as little as two cents per child annually, is one of the highest-return public health interventions ever measured: every dollar spent returns an estimated $30 in future cognitive capacity.
The pattern in the data is clear. Countries at the top of the IQ ranking tend to have high Education Index scores. Countries at the bottom tend to have low ones. That is not a coincidence. It is a direct reflection of what IQ tests actually measure: skills built by schooling, not fixed traits people are born with.
Wealth Buys Test Scores, Not Intelligence
If national IQ were simply a function of money, the richest countries would dominate the ranking. They do not. The Gulf states illustrate this perfectly.
Qatar scores 97.94. United Arab Emirates scores 97.39. Saudi Arabia scores 94.07. All three are among the wealthiest nations on Earth by GDP per capita. All three sit near or below the global average on this IQ measure. The money is there. The scores are not.
Meanwhile, Vietnam scores 102.26 on a per-capita income roughly one-tenth of Qatar's. Iran, under decades of international sanctions, scores 104.8, the highest of any country outside East Asia. These countries cannot outspend the Gulf states. But they can, and do, outperform them on cognitive assessments.
The explanation is structural. Vietnam's education system punches well above its economic weight: the country scored 468 on the 2022 PISA exam, higher than many OECD nations with far larger budgets. Iran has a long tradition of university education and competitive academic culture that persists despite economic isolation.
What wealth does buy is access: to schools, to nutrition, to healthcare, to stable electricity and internet connections. Where that access is broad and the education system is strong, scores rise. Where the access exists but the education system emphasizes rote learning or excludes large portions of the population, scores plateau. The data suggests that how a country spends on education matters far more than how much.
Who Takes an Online IQ Test, and Why That Matters
Every number in this ranking comes from the same source: a single online IQ test taken voluntarily by 1.2 million people in 2025. That consistency is a real strength. Unlike older national IQ compilations that stitched together dozens of different tests given to wildly different samples, this dataset uses one instrument for everyone.
But online testing comes with its own set of biases, and they matter for how you read the bottom of this ranking.
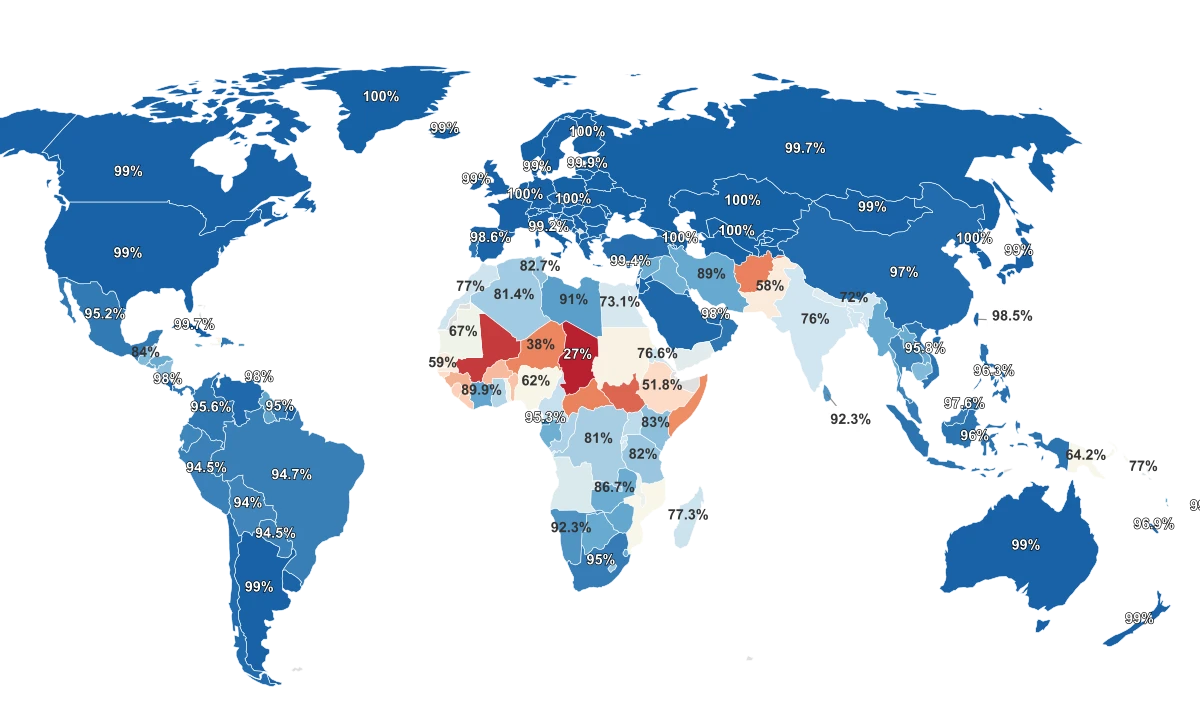
The people who take an online IQ test are not a random sample of their country's population. They are people with internet access, a device, the literacy to navigate a website, and the motivation to sit for a cognitive assessment. In countries with near-universal internet access, like Australia (104.45) or South Korea (106.97), the test-taking pool is fairly broad. In countries where internet penetration is low, the pool is heavily skewed toward the urban, educated, and wealthy.
Somalia anchors the bottom of this ranking at 83.84. It also has one of the lowest mean years of schooling in the world at just 1.9 years, according to the UNDP. The Somalis who take an online IQ test are, almost by definition, not representative of the broader population. They are the ones with electricity, internet, and enough formal education to find and complete the test. The true national cognitive average, if such a thing could be measured, would be shaped by entirely different variables.
This dynamic means the bottom of the ranking likely overstates the gap between high-scoring and low-scoring countries. The people actually represented in the data from low-income nations are closer in profile to the global middle than the ranking suggests.
One reassuring signal: the dataset shows strong year-to-year consistency. In 84.8% of countries, average scores shifted by less than 2 points from one year to the next. That kind of stability suggests the test is capturing a real, persistent signal, even if that signal is shaped as much by who takes the test as by what the test measures.