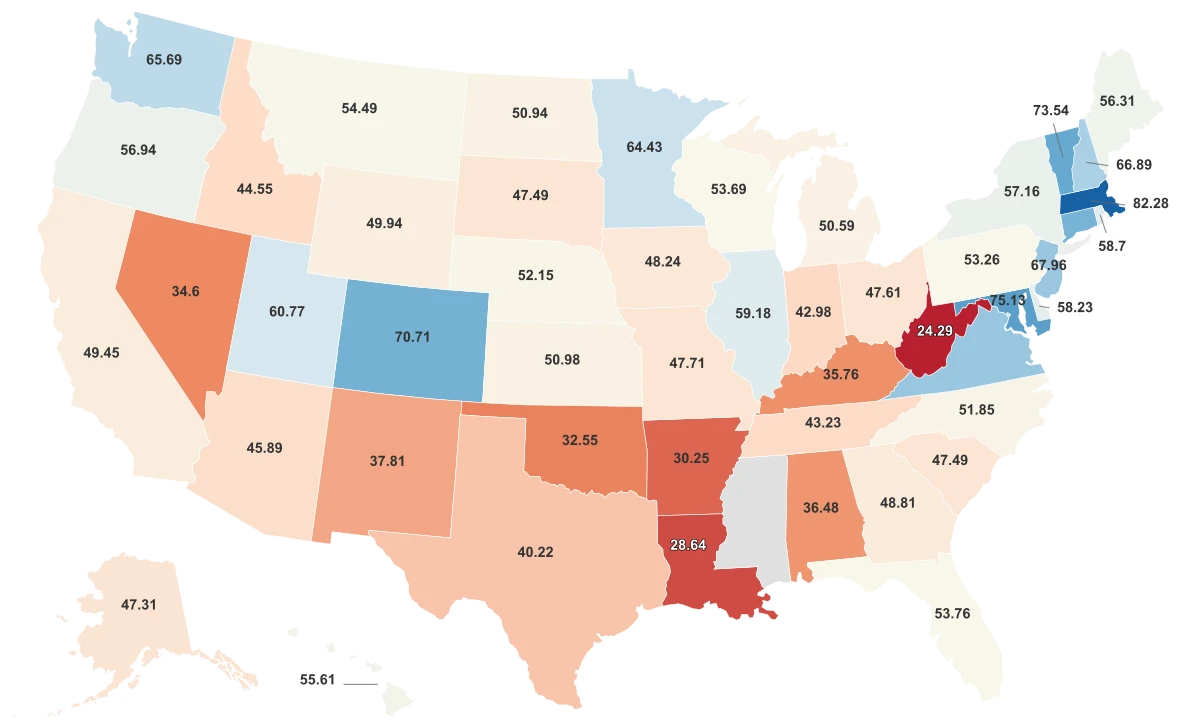
The Best Schools in America Share One Region
This ranking is built on a WalletHub composite index of 32 weighted metrics spanning two dimensions: Quality (NAEP test scores, graduation rates, pupil-to-teacher ratios, AP performance, instructor credentials) and Safety (bullying rates, school violence, drug prevalence, safety policies). Each state receives a score on a 100-point scale, where higher means better. It is not a single test score or a single spending figure. It is a broad snapshot of how a state's public school system performs across dozens of indicators.
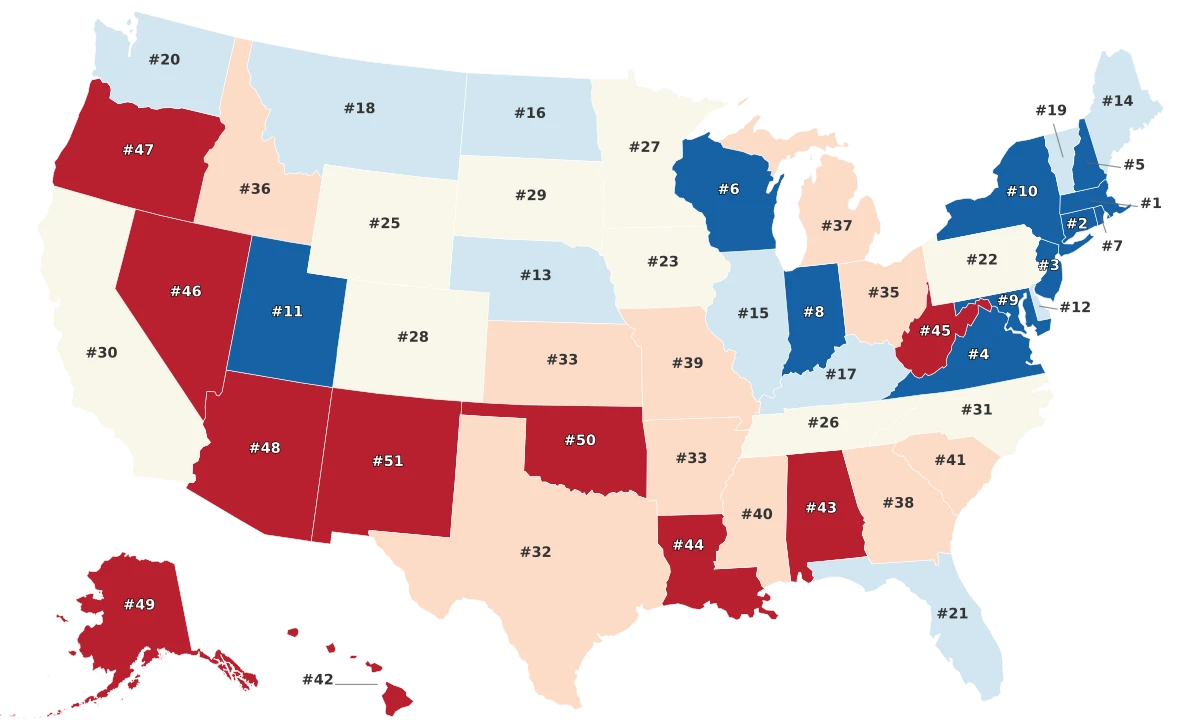
Massachusetts leads the nation at 74.34. New Mexico anchors the bottom at 30.37. The gap between first and last is nearly 44 points on a 100-point scale, which means the top-ranked state scores more than double the lowest. Between those two extremes, the dataset breaks into loose tiers: a cluster of Northeastern states at the top, a broad middle spanning the Midwest and parts of the South, and a group of Western and Southern states at the bottom.
The regional pattern is hard to miss. The Northeast averages 60.86 on the index, compared to 52.74 in the Midwest, 48.93 in the South, and 45.74 in the West. Seven of the top 10 states sit in the Northeast or Mid-Atlantic, led by Connecticut (67.47), New Jersey (63.81), and Virginia (61.32).
The bottom of the ranking clusters in a different geography. Oregon (38.16), Arizona (37.7), and Alaska (35.88) fill out the bottom five alongside Oklahoma (32.62) and New Mexico. Oklahoma and New Mexico are both statistical outliers, falling more than two standard deviations below the national mean.
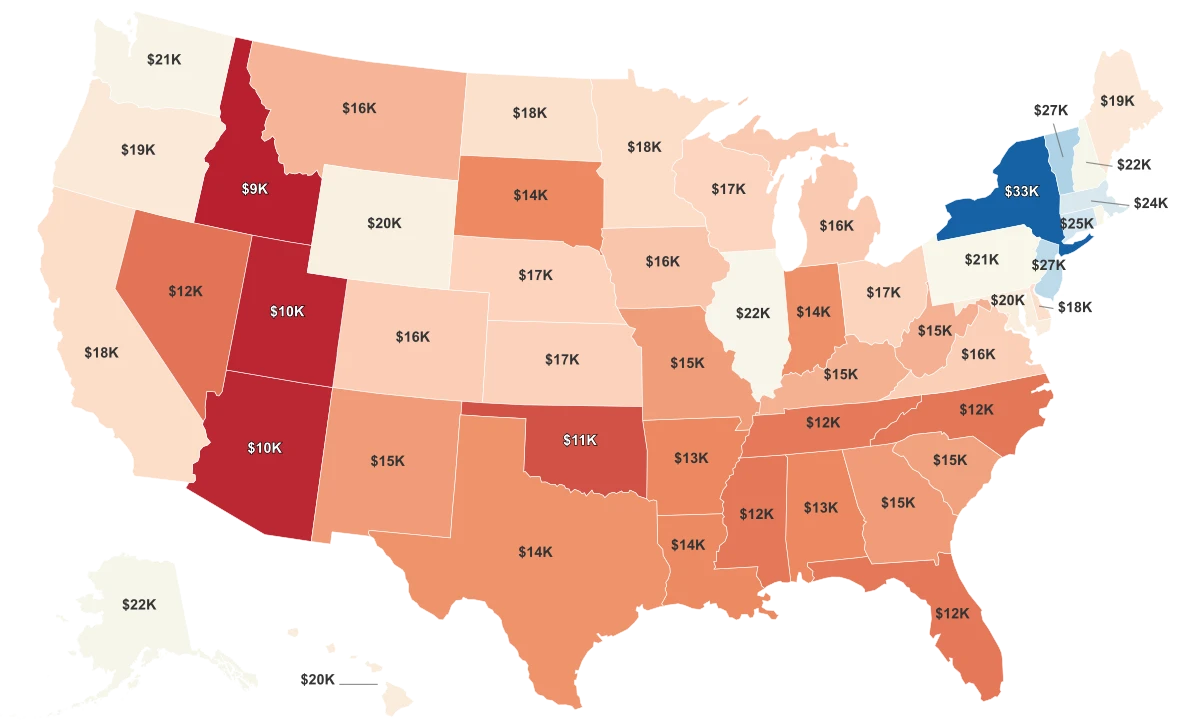
Why Spending More Does Not Always Mean Better Schools
The intuitive assumption is that states spending more per student should have better schools. The data tells a messier story. Spending and school quality track in the same general direction, but the relationship is far from tight.
New York spends more per pupil than any other state at $33,400, roughly 3.5 times what Idaho spends ($9,400). But New York ranks 10th on the index, not first. Alaska spends $22,000 per student and still ranks near the very bottom. Spending a lot clearly does not guarantee results.
The flip side is just as striking. Indiana spends just $14,200 per student and ranks 8th. Virginia spends $16,400 and ranks 4th. Both outperform states spending 50% more. Per-pupil spending is a necessary ingredient, not a sufficient one.
More Money Helps, but It Is Not the Whole Story
States like Utah and Indiana score well above what their spending would predict, while Alaska spends heavily and ranks near the bottom.
The most dramatic case is Utah. It spends just $10,000 per student, less than every state except Idaho. Yet it ranks 11th overall, with an index score of 56.83. The Utah Foundation attributes this to demographics: Utah has the youngest population in the country and the largest average family sizes, which means tax revenue is divided among far more students. The state compensates with lean administration, large school districts that create economies of scale, and the nation's highest student-to-teacher ratios. It is efficient, though critics point out that efficiency comes at the cost of crowded classrooms.
At the regional level, the spending divide is stark. The Northeast averages roughly $24,500 per student. The South averages about $14,600, barely 60% of the Northeastern figure. That gap has been widening: from 2023 to 2025, K-12 spending rose by an average of 6.5% nationally, but the biggest increases went to states already at the top. New Jersey's per-pupil spending jumped 11.3% in two years. Kansas, already in the lower half, saw its spending decline by 1.8%.
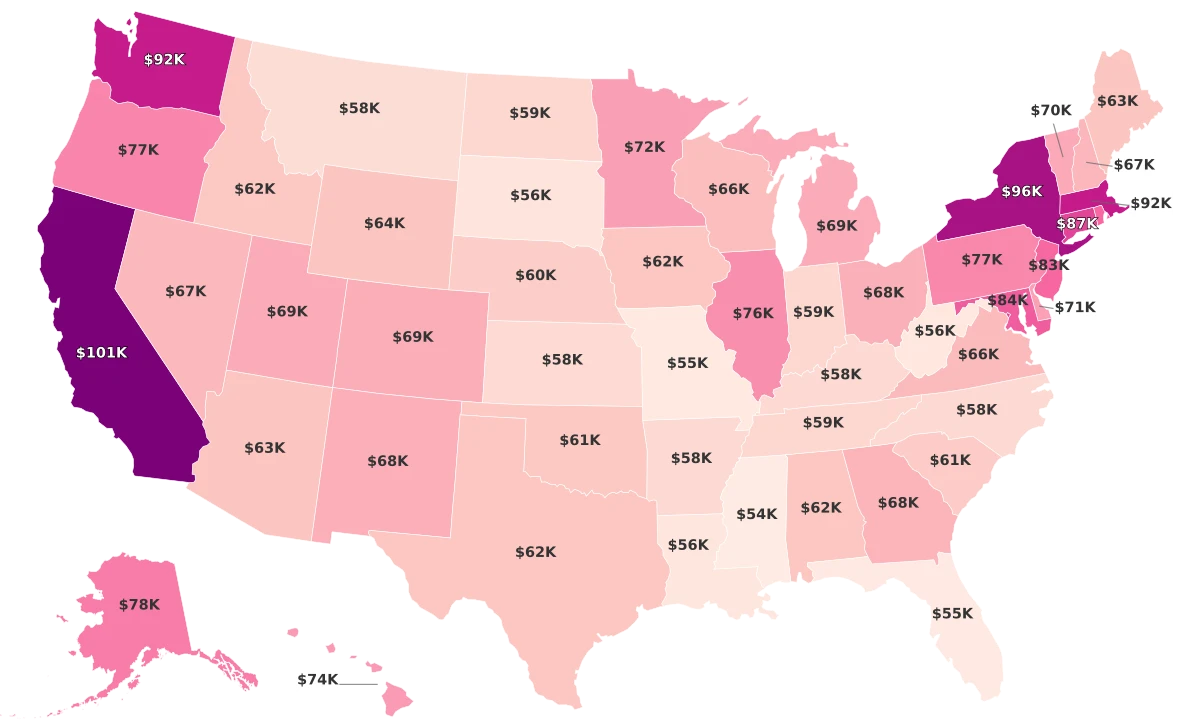
The States Raising Teacher Pay the Fastest, and What It Has Changed
Average teacher pay across all 50 states rose 9.17% between 2022 and 2024, according to the National Education Association. That is a significant bump by historical standards, but the increases were not spread evenly.
New Mexico gave its teachers the largest raise in the country: a 26% increase from $54,272 to $68,400 in two years. The state's governor signed legislation in 2022 setting minimum salaries of $50,000, $60,000, and $70,000 across a three-tier licensure system, with additional raises in 2023 and 2024. In terms of rank, New Mexico climbed 16 spots in the teacher salary rankings, from 37th to 21st. Utah (+18%, up 9 spots), Colorado (+17.5%, up 8 spots), and California (+15.8%) also made aggressive moves.
Teacher Pay Jumped Nearly 10% in Two Years, but Not Everywhere
New Mexico leaped 16 spots in the salary rankings while Kansas fell 11, creating a rapidly shifting pay landscape for educators.
On the other end, Kansas fell 11 spots in the salary rankings as its average rose just 6.2%, well below the national pace. Iowa and North Dakota each dropped 8 spots. Mississippi still pays the lowest average teacher salary in the country at $53,700, roughly half of what California pays.
Here is the counterintuitive finding: teacher salary shows almost no statistical relationship with school quality. California pays the highest average salary at $101,100 and scores 50.46 on the index, placing it 30th. New Mexico gave its teachers the biggest raise in the nation and still ranks dead last. The salary strategy is less about buying better test scores and more about filling vacancies. Both states have struggled with severe teacher shortages and a reliance on emergency-certified personnel. Raising pay is a precondition for improvement, not a shortcut to it.
What Actually Separates First Place From Last
Massachusetts scores 74.34. New Mexico scores 30.37. The gap is wider than the entire middle third of the ranking. What makes these two states the bookends is not a single policy difference. It is a 30-year divergence in systemic investment.
Massachusetts' modern education system traces to the Education Reform Act of 1993, a landmark law that combined three things: an equity-based funding formula that directed more money to high-need districts, rigorous curriculum standards, and the MCAS accountability exam that made graduation contingent on demonstrated proficiency. The state leads NAEP scores in all four assessment categories: 4th-grade reading, 4th-grade math, 8th-grade reading, and 8th-grade math. A 2019 follow-up law, the Student Opportunity Act, further updated the funding model to address persistent achievement gaps for English learners, students of color, and low-income students.
New Mexico faces a different set of structural forces. The state has one of the highest child poverty rates in the country, and its school budgets are heavily dependent on oil and gas severance taxes, which create boom-and-bust cycles that make long-term planning difficult. A large English Learner population adds instructional complexity. The teacher shortage has been acute enough to require thousands of emergency-certified instructors in recent years. The salary increases are an attempt to break that cycle by making New Mexico competitive for talent, but the underlying structural challenges remain.
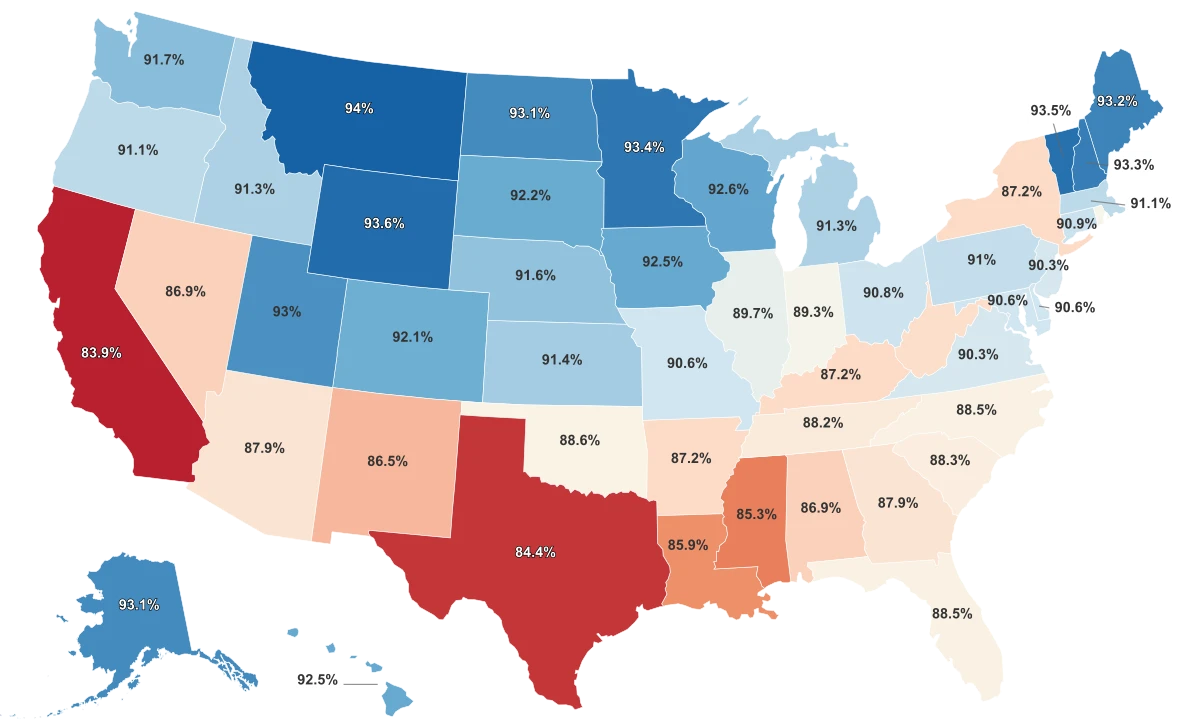
One more pattern worth noting: high school completion rates do not track neatly with school quality either. California and Texas have the lowest completion rates in the country at 83.9% and 84.4%, driven largely by their massive immigrant and English Learner populations. Yet California ranks 30th on the index and Texas ranks 32nd, both above states like West Virginia (87.6% completion, 45th on the index) and Oklahoma (88.6% completion, 50th). Completion rates measure who finishes. They do not tell you much about what students learned along the way, which is why the composite index weights test performance, safety, and instructional quality alongside graduation numbers.