Key Findings
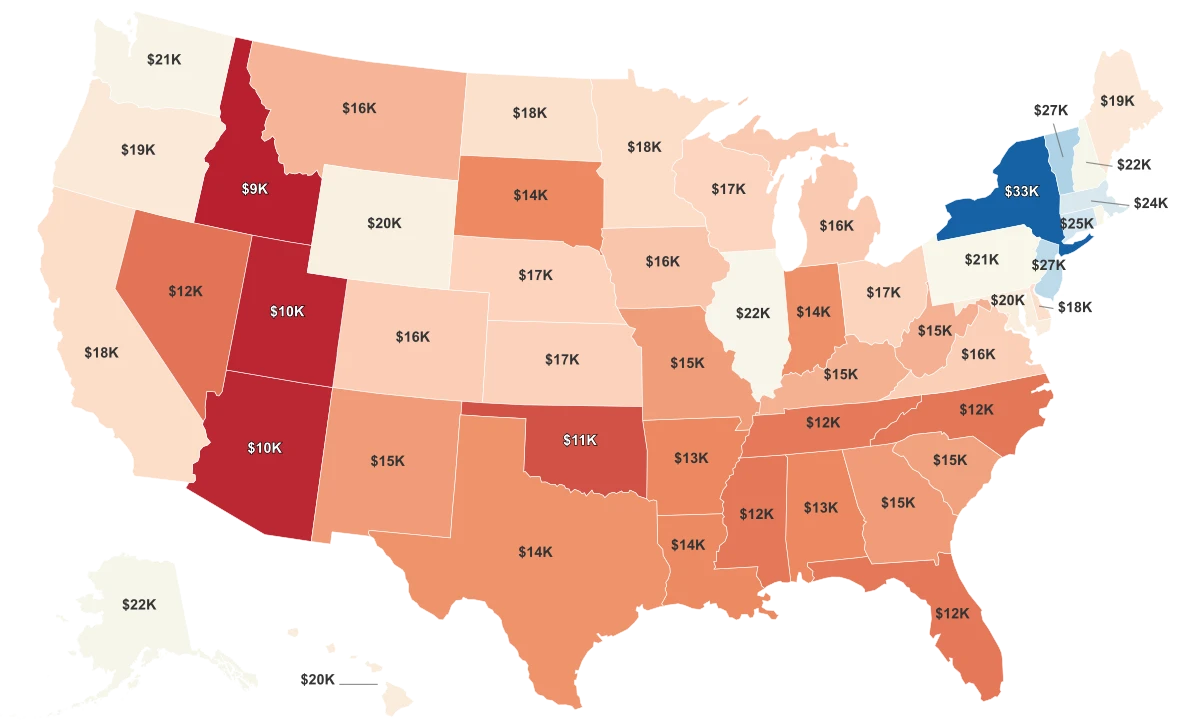
- New York leads the nation in K-12 spending, investing around $33,400 per student, followed by Vermont ($27,000) and New Jersey ($26,600).
- Utah and Idaho remain at the lower end, each spending less than $10,000 per student, roughly one-third of the national leaders.
- Between 2023 and 2025, average per-pupil spending rose across nearly all states, with several — including Illinois, Connecticut, and Massachusetts — surpassing the $20,000 threshold.
- Federal contributions typically account for less than 10% of total K-12 funding, but states such as Alaska, Kentucky, and Mississippi rely more heavily on federal aid due to economic and demographic factors.
- Local funding drives spending disparities: states with higher property-tax bases, like New York and Connecticut, invest substantially more per student than those with more limited tax capacity.
How Education Spending Reflects State Investment in Students
“K-12” refers to the combined grades from kindergarten through 12th grade, covering the full span of primary and secondary education before college. Public K–12 schooling is funded by federal, state and local governments, each playing a role in how much is spent per student. Research from the Institute for Policy Research at Northwestern University finds that when spending is increased and sustained across a student’s entire K-12 education, that student is more likely to graduate and earn higher wages as an adult.
Per-pupil K-12 spending in the U.S. varies widely — from around $9,500 in lower-spending states to over $30,000 in the highest-spending states. According to data from United States Census Bureau, the national average spending per pupil recently increased by nearly 9% between 2021 and 2022, reaching roughly $15,633 in that period. Yet this national average only tells part of the story—behind it lies a very wide range of state spending levels and markedly different regional dynamics.
In states like New York, per-pupil current expenditures in 2022 rose to almost $29,873, more than double what the lowest-spending states were doing in the same period. By contrast, states such as Utah and Idaho were operating at levels near $9,500–$10,000 per pupil. These differences reflect more than just budget size: high costs of living, large rural districts with long transport routes, and generous teacher-retirement systems all push up spending in some states. At the same time, states with tighter budgets or rapidly growing student rolls may spend less.
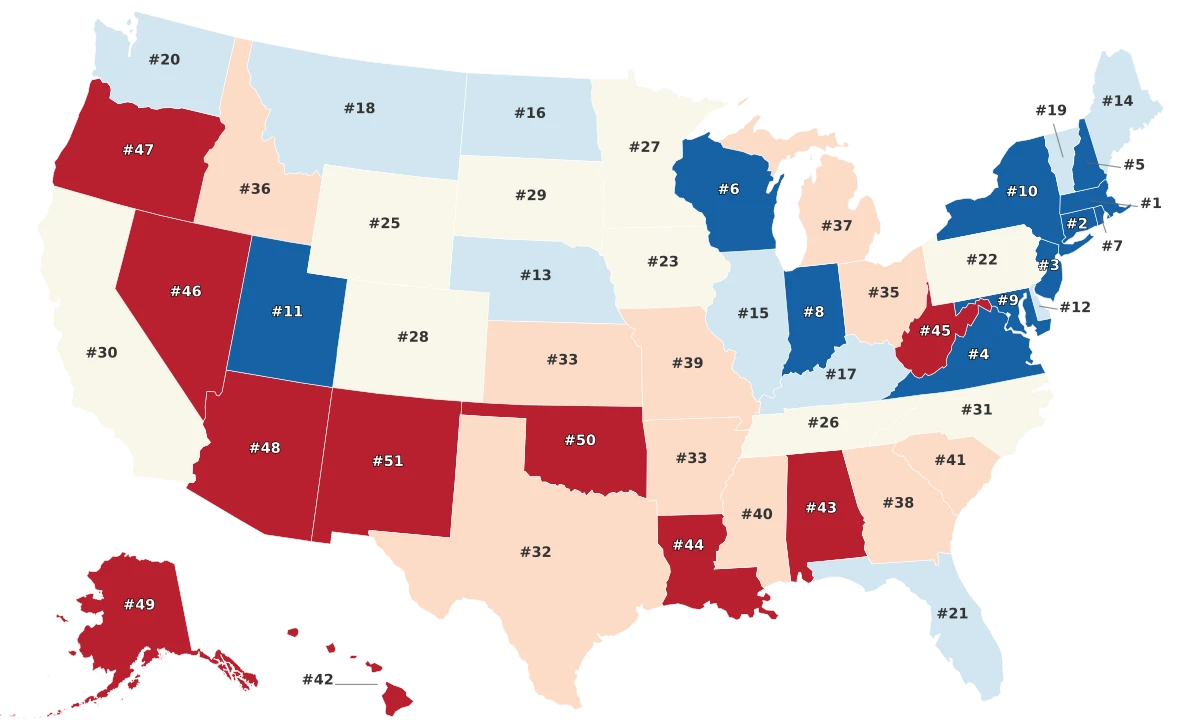
States with the Highest Per-Pupil Spending
New York ranks 1st in K-12 spending at $33,400 per student, nearly twice the national average and supported by one of the highest education tax shares (5.26%). Vermont follows in 2nd with $27,000, the largest tax burden nationwide (5.21%), reflecting its strong state-level funding model. New Jersey ranks 3rd at $26,600, boosted by high local revenues of about $13 K per pupil, while Connecticut in 4th spends $25,000, sustained by one of the nation’s most robust local funding systems. Massachusetts places 5th at $24,400, driven by strong household incomes and consistent investment in education quality. Alaska ranks 6th at $22,000, supported by the highest federal aid per pupil ($4.4 K). New Hampshire ranks 7th with $21,900, Illinois 8th at $21,800, and Pennsylvania 9th at $21,400. Rounding out the list, Rhode Island ranks 10th with $21,100.
Top 10 Highest-Spending States
| State | Average Per-Pupil K-12 Spending |
|---|---|
| New York | $33,437 |
| Vermont | $26,974 |
| New Jersey | $26,558 |
| Connecticut | $25,023 |
| Massachusetts | $24,359 |
| Alaska | $22,000 |
| New Hampshire | $21,898 |
| Illinois | $21,829 |
| Pennsylvania | $21,441 |
| Rhode Island | $21,051 |
Top 10 Highest-Spending States
| State | Average Per-Pupil K-12 Spending |
|---|---|
| New York | $33,400 |
| New Jersey | $26,600 |
| Vermont | $27,000 |
| Connecticut | $25,000 |
| Massachusetts | $24,400 |
| Alaska | $22,000 |
| Rhode Island | $21,100 |
| Pennsylvania | $21,400 |
| New Hampshire | $21,900 |
| Illinois | $21,800 |
Lowest Per-Pupil Spending
Idaho has the lowest K-12 spending in the U.S., at just $9,400 per student, less than two-thirds of the national average. Utah ranks 2nd lowest at $10,000. Arizona ranks 3rd, maintaining the 3rd smallest education tax shares (2.46%) nationwide. Oklahoma ranks 4th lowest at $11,300, while Nevada ranks 5th lowest at $12,200 per student. North Carolina (6th), Mississippi (7th), Florida (8th), and Tennessee (9th) share similar levels at around $12,400. Arkansas rounds the top 10 with $13.3K.
Bottom 10 Lowest-Spending States
| State | Average Per-Pupil K-12 Spending |
|---|---|
| Idaho | $9,400 |
| Utah | $10,000 |
| Arizona | $10,100 |
| Nevada | $12,200 |
| Florida | $12,400 |
| Mississippi | $12,400 |
| Tennessee | $12,400 |
| North Carolina | $12,400 |
| Oklahoma | $11,300 |
| Alabama | $13,500 |