Only Ten States Have More Men Than Women
At birth, the ratio leans male. Roughly 105 boys are born for every 100 girls in the United States, a biological constant across virtually every state. But by the time the full population is counted, the advantage reverses. Nationally, there are about 97 men for every 100 women.
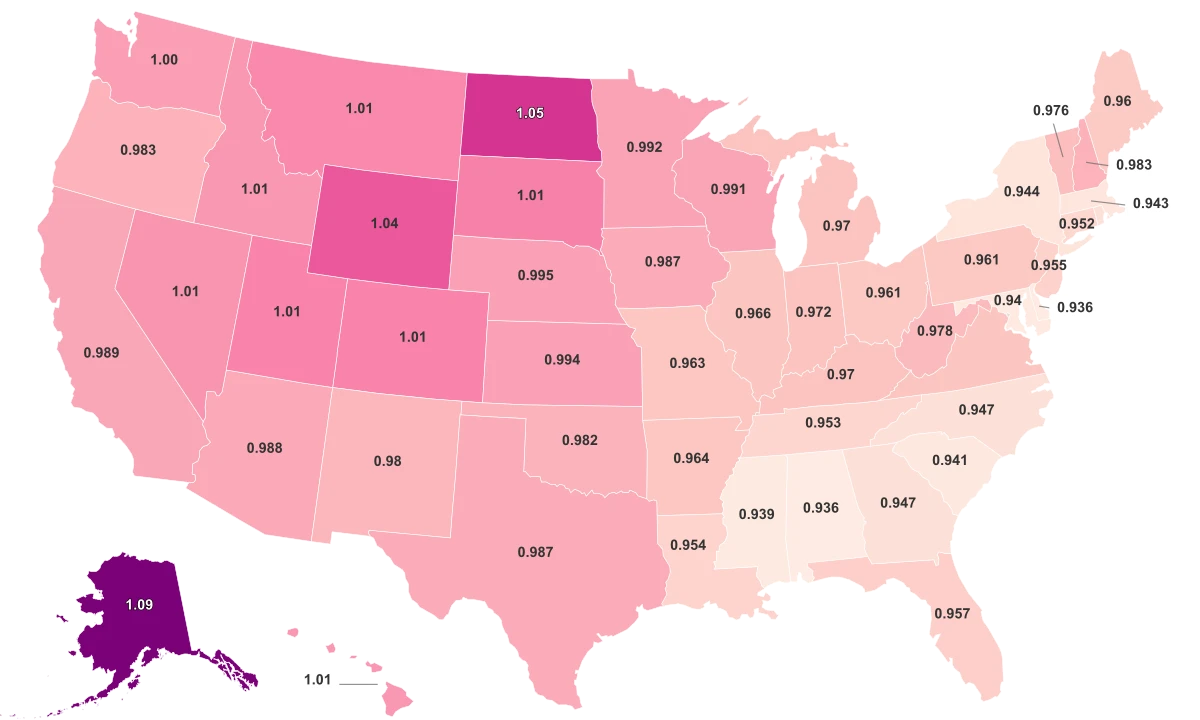
Only ten states report a sex ratio above 1.00. Alaska leads at 1.09: 109 men for every 100 women, a gap above parity wider than any other state. North Dakota (1.05) and Wyoming (1.04) are the only others above 1.03. After those three, the remaining male-majority states hover at 1.01 or 1.02, barely distinguishable from even.
At the bottom, seven states share the lowest ratio at 0.94, from Alabama to New York. The entire range between first and last is just 15 men per 100 women, narrower than most people would guess.
The regional pattern is cleaner than the state-by-state list suggests. Western states average 1.01 males per female. The Midwest averages 0.99. The South and the Northeast both average 0.96. That five-point regional gap reflects structural differences in industry, military presence, and age demographics that play out the same way in state after state.
Oil Rigs, Military Bases, and the Geography of Where Men Go
Alaska sits nine points above parity, the widest margin in the country. The explanation is economic. Commercial fishing, oil and gas extraction, mining, and timber form the backbone of the state economy, and those sectors employ far more men than women. Alaska also hosts several major military installations, including Joint Base Elmendorf-Richardson and Eielson Air Force Base, adding another predominantly male population.
Demographic researchers have documented a pattern of gendered out-migration in rural Alaska: young women leave small villages for cities or other states at significantly higher rates than young men, drawn by education and professional opportunities the bush does not provide. The ratio gets pushed higher from both sides.
North Dakota owes its position to a more specific event. The Bakken shale oil boom, which accelerated around 2008, drew thousands of extraction workers to the western counties. A 2014 analysis by the Pew Research Center found that men accounted for roughly two-thirds of the state's population growth during the peak years. Workers lived in temporary housing and "man camps," often leaving families in their home states. The statewide ratio settled at 1.05.
Wyoming (1.04) follows the same template: coal, natural gas, and oil extraction anchor the economy. Hawaii (1.01) is the one top state driven less by resource extraction than by the military. Pearl Harbor and other installations maintain a large, predominantly male population on the islands that nudges the ratio above parity despite Honolulu's urban diversity.
Women Outlive Men by Five Years. That Changes the Rest of the Map.
The biological baseline explains much of the rest of the ranking. Boys are born at a rate of roughly 105 per 100 girls. But men die at higher rates throughout their lives: from heart disease, accidents, suicide, and high-risk occupations. CDC life expectancy data shows that American women outlive men by roughly five years on average. By age 65, women outnumber men in nearly every state.
That longevity gap is amplified in states with older populations. Maine (0.96) has one of the highest median ages in the country. Florida (0.96) is the nation's most popular retirement destination. Both tilt female not because men are leaving, but because older age groups naturally contain more women. The South and the Northeast, the two regions averaging 0.96, share this profile: established economies, aging residents, and no frontier-industry magnet pulling in young male workers.
Seven states share the bottom at 0.94, stretching from Alabama to New York. On a map, they look unrelated: Deep South, Mid-Atlantic, New England. What they share is a combination of urbanization, older demographics, and, in the Southern states, some of the widest gender gaps in life expectancy in the country. According to the U.S. Census Bureau, urban and suburban areas consistently attract more women for education and careers. The ratio at the bottom of this ranking reflects where men die younger and where women concentrate for opportunity, not a single cause but the same forces, stacked.