Median Home Price By State

United StatesUnited States
$440,529.41Home PriceNational Average
$40,376.96Median Household IncomeNational Average
103.59Cost of Living IndexNational Average
Median Home Price 2025Question Mark
Map visualization
$248K$1M
Compared to 2024
1
District of ColumbiaDistrict of Columbia
$1,170,000+72.9K (+6.6%)
2
HawaiiHawaii
$966,000+9016.67 (+0.9%)
3
CaliforniaCalifornia
$869,000+18K (+2.1%)
42
MassachusettsMassachusetts
$669,000+28.2K (+4.4%)
51
WashingtonWashington
$668,000+6358.33 (+1.0%)
61
ColoradoColorado
$660,000+9283.33 (+1.4%)
7
UtahUtah
$622,000+25.4K (+4.3%)
8
New JerseyNew Jersey
$567,000+31.9K (+6.0%)
9
MontanaMontana
$541,000+6991.67 (+1.3%)
102
MarylandMaryland
$530,000+15.1K (+2.9%)
11
OregonOregon
$528,000+5116.67 (+1.0%)
112
New HampshireNew Hampshire
$528,000+24.8K (+4.9%)
131
Rhode IslandRhode Island
$522,000+26.2K (+5.3%)
143
ConnecticutConnecticut
$505,000+34.3K (+7.3%)
155
New YorkNew York
$502,000-24.8K (-4.7%)
15
NevadaNevada
$502,000+11.7K (+2.4%)
171
IdahoIdaho
$494,000+13.1K (+2.7%)
18
VirginiaVirginia
$481,000+18.2K (+3.9%)
192
WyomingWyoming
$475,000+46.6K (+11%)
201
ArizonaArizona
$463,000+1,925 (+0.4%)
211
FloridaFlorida
$435,000-708.33 (-0.2%)
211
VermontVermont
$435,000+12.3K (+2.9%)
233
AlaskaAlaska
$413,000+19.3K (+4.9%)
24
TennesseeTennessee
$405,000+10.4K (+2.6%)
25
South CarolinaSouth Carolina
$404,000+9591.67 (+2.4%)
261
DelawareDelaware
$401,000+7,800 (+2.0%)
262
North CarolinaNorth Carolina
$401,000+12.4K (+3.2%)
285
MaineMaine
$392,000-6,150 (-1.5%)
29
GeorgiaGeorgia
$387,000+2333.33 (+0.6%)
30
MinnesotaMinnesota
$381,000+15.3K (+4.2%)
31
New MexicoNew Mexico
$377,000+24.4K (+6.9%)
32
TexasTexas
$346,000-3583.33 (-1.0%)
331
WisconsinWisconsin
$340,000+18.4K (+5.7%)
341
South DakotaSouth Dakota
$335,000+8,225 (+2.5%)
35
PennsylvaniaPennsylvania
$331,000+18.3K (+5.9%)
36
IllinoisIllinois
$310,000+17.4K (+5.9%)
371
North DakotaNorth Dakota
$305,000+16.8K (+5.8%)
381
NebraskaNebraska
$304,000+12K (+4.1%)
39
KansasKansas
$299,000+17.6K (+6.2%)
40
AlabamaAlabama
$290,000+11.6K (+4.2%)
41
MissouriMissouri
$282,000+15.7K (+5.9%)
42
KentuckyKentucky
$278,000+12.4K (+4.7%)
43
MichiganMichigan
$276,000+14K (+5.4%)
44
IndianaIndiana
$274,000+12.8K (+4.9%)
45
ArkansasArkansas
$268,000+12.2K (+4.8%)
46
OhioOhio
$267,000+13.2K (+5.2%)
47
MississippiMississippi
$262,000+11.3K (+4.5%)
48
LouisianaLouisiana
$257,000+9316.67 (+3.8%)
49
OklahomaOklahoma
$254,000+7183.33 (+2.9%)
501
IowaIowa
$248,000+11.1K (+4.7%)
50
West VirginiaWest Virginia
$248,000+1808.33 (+0.7%)
Share

Last updated February 28, 2026

State-by-State Housing Cost Variations

In 2025, the U.S. housing market remains historically expensive, though it is showing signs of stabilization. According to the Federal Reserve Bank of St. Louis (FRED), the median home price reached approximately $410,800 in the second quarter of 2025, having increased nearly 55% between the first quarter of 2020 and the first quarter of 2025.

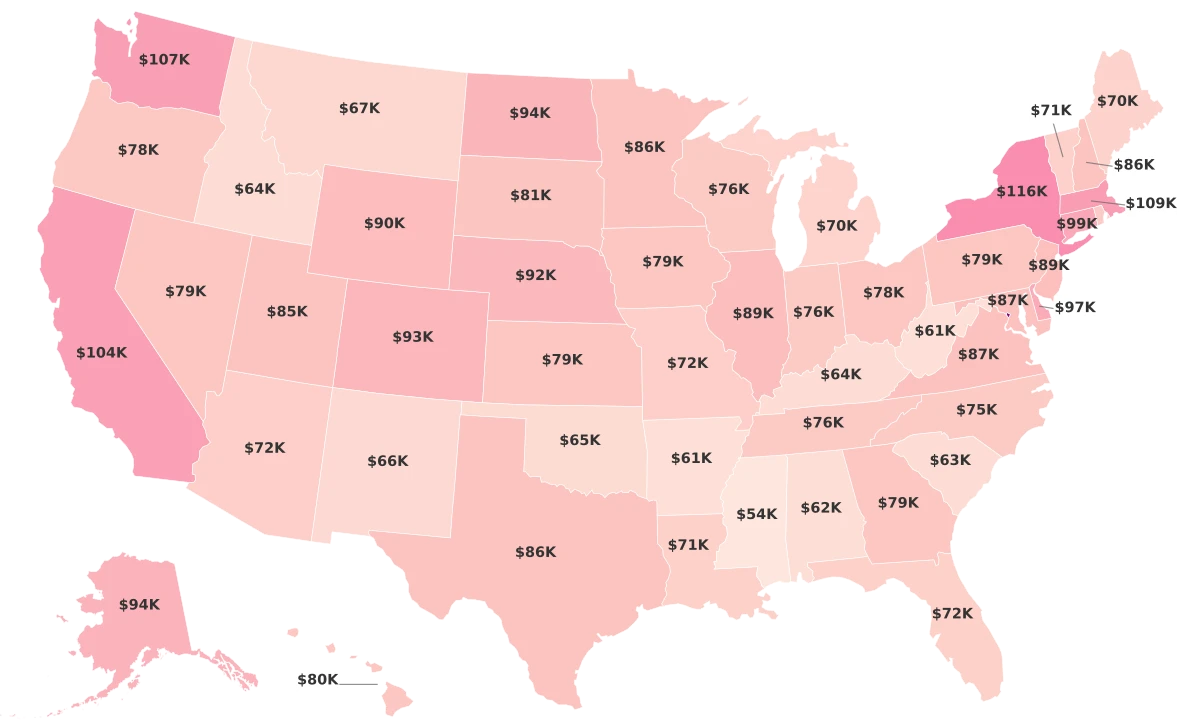
Cost pressures are driven not only by tight supply but also by the rising price-to-income ratio—households are currently paying approximately 5x their annual income for a home, compared to about 3,5x in the mid-1980s. With 30-year mortgage rates remaining high and labor markets erratic, national price growth has slowed to low single digits.

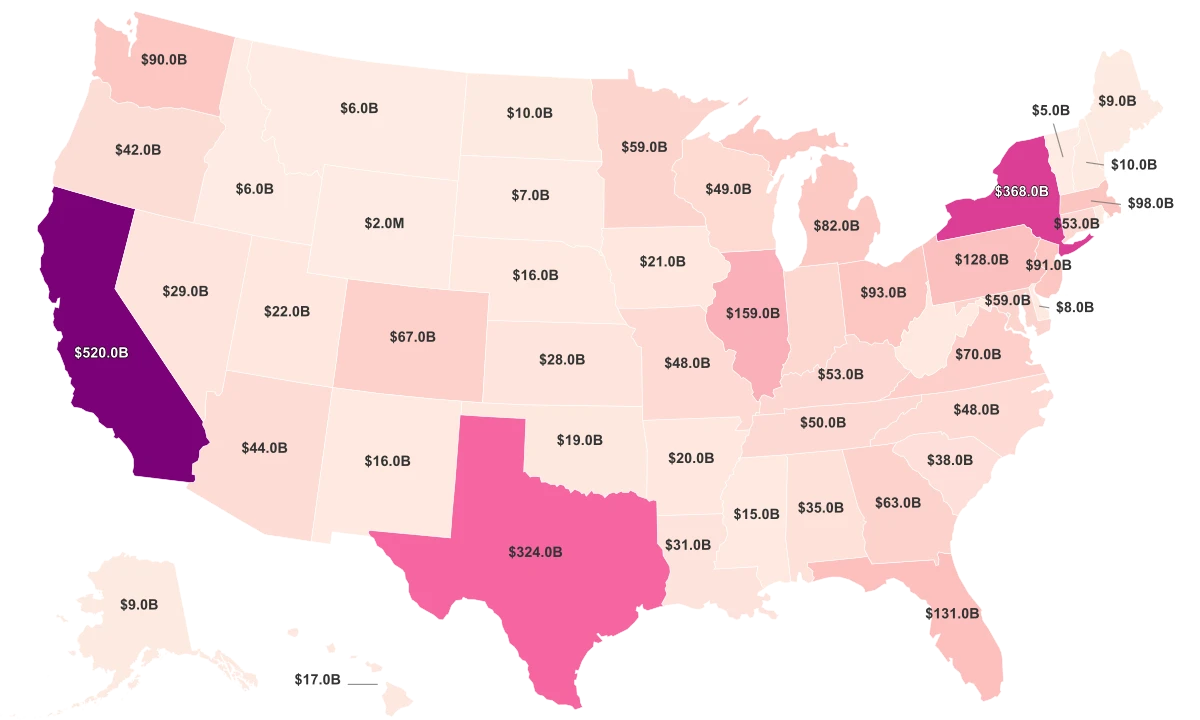
However, at the state level, the picture is far from uniform: states like California have median prices well above $800,000, while others remain below $250,000. This reflects the influence of local regulations, supply bottlenecks and migration patterns.

What Shapes Home Prices

  • Mortgage rates are now elevated—hovering around 6 %–7%—which limits demand even as sellers hold on to high valuations.
  • Supply remains tight. Despite modest improvement, inventory is still well below pre-pandemic levels, helping prices stay firm.
    Affordability has taken a hit. According to Realtor.com, the typical U.S. household would now need to spend about 44.6% of income to afford a median-priced home, far above the 30% guideline.
  • Regional divergence remains strong. While the national median sits near $410K, some states feature medians over $800,000, and others remain under $250,000, driven by local factors such as regulation, migration, labor markets and housing stock.

All Metrics

Region ↕Home Price 2025↕Median Household Income 2023↕Cost of Living Index 2024↕
District of Columbia$1.17M$75.8K141.9
Hawaii$966K$44.4K186.9
California$869K$50.3K144.8
Massachusetts$669K$45.9K145.9
Washington$668K$48.4K114.2
Colorado$660K$49.4K102.0
Utah$622K$44.9K104.9
New Jersey$567K$48.5K114.6
Montana$541K$35.4K94.9
Maryland$530K$52.5K115.3
Oregon$528K$39.8K112.0
New Hampshire$528K$45.7K112.6
Rhode Island$522K$42.2K112.2
Connecticut$505K$44.2K112.3
New York$502K$42.4K123.3
Nevada$502K$42K101.3
Idaho$494K$36K102.0
Virginia$481K$46.8K100.7
Wyoming$475K95.5
Arizona$463K$41.3K111.5
Florida$435K$39.4K102.8
Vermont$435K$39.6K114.4
Alaska$413K$46.8K123.8
Tennessee$405K$36.3K90.5
South Carolina$404K$36.6K95.9
Delaware$401K$42.2K100.8
North Carolina$401K$38.1K97.8
Maine$392K$36K112.1
Georgia$387K$40K91.3
Minnesota$381K$43.2K95.1
New Mexico$377K$36K93.3
Texas$346K$41.7K92.7
Wisconsin$340K$40K97.0
South Dakota$335K$37.3K92.2
Pennsylvania$331K$37.7K95.1
Illinois$310K$41.9K94.4
North Dakota$305K$39.7K91.9
Nebraska$304K$38.3K93.1
Kansas$299K$36.5K87.0
Alabama$290K$31.2K88.0
Missouri$282K$36.3K88.7
Kentucky$278K$31.5K93.0
Michigan$276K$36.7K90.4
Indiana$274K$36.7K90.5
Arkansas$268K$30.7K88.7
Ohio$267K$36.6K94.2
Mississippi$262K$27.2K87.9
Louisiana$257K$29.9K92.2
Oklahoma$254K$32.7K85.7
Iowa$248K$37.2K89.7
West Virginia$248K$29.1K84.1

Key Findings

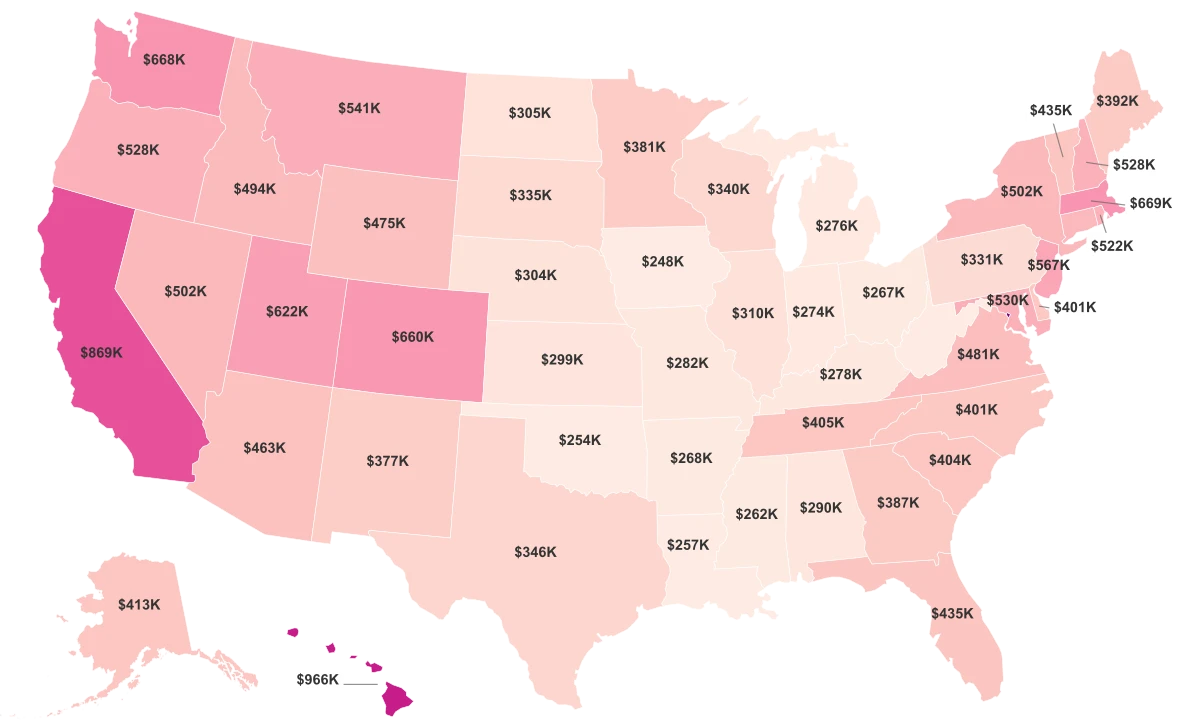
  • California remains the most expensive state, with a median home price of $833K, followed by Hawaii ($743K) and Washington, D.C. ($643K).
  • Iowa is the least expensive, at $228K, while Ohio ($241K) and Oklahoma ($244K) round out the bottom three.
  • The national median price is still roughly one-third higher than pre-COVID levels, despite elevated interest rates.
  • Insurance premiums have become a growing factor in total housing costs in Florida, California, and coastal regions.
  • Inventory improved for the 22nd consecutive month, but remains below 2018–2019 levels, keeping pressure on prices.
  • Analysts expect prices to stay flat or rise slightly in 2026 if rates continue to stabilize and construction activity expands.

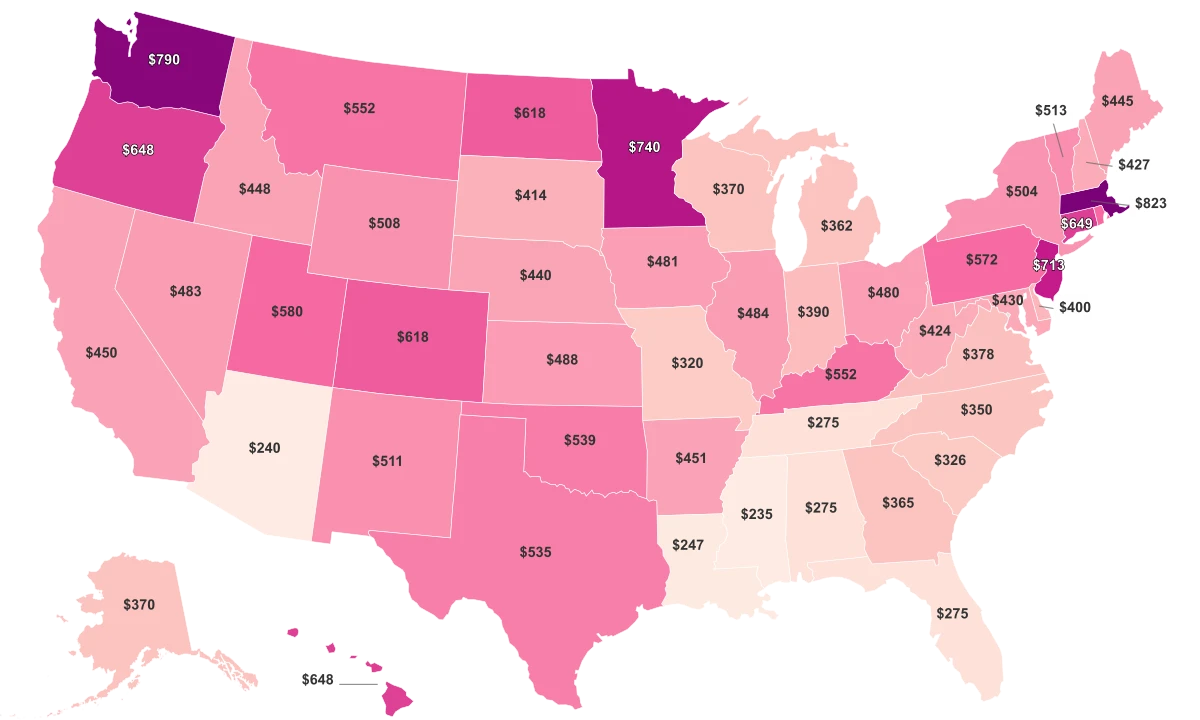
States with the Lowest Home Sales Prices

California has the highest median home price at $833,000. Hawaii ranks 2nd at $743,000, followed by the District of Columbia (3rd, $643,000). Washington comes 4th ($630,000), and Massachusetts 5th ($615,000). Colorado ranks 6th ($582,000), New York 7th ($576,000), Utah 8th ($548,000), Montana 9th ($523,000), and New Jersey 10th ($521,000).

Top 10 Most Expensive Housing Markets (2025)

State Median Home Price
California $833K
Hawaii $743K
District of Columbia $643K
Washington $630K
Massachusetts $615K
Colorado $582K
New York $576K
Utah $548K
Montana $523K
New Jersey $521K

States with the Lowest Median Home Prices

West Virginia has the lowest median home price at $249,000. Louisiana ranks 2nd at $249,000, followed by Missouri (3rd, $258,000). Kentucky comes 4th ($263,000), and Nebraska 5th ($289,000). Ohio ranks 6th ($241,000), Oklahoma 7th ($244,000), Arkansas 8th ($253,000), Mississippi 9th ($253,000), and Indiana 10th ($255,000).

10 Least Expensive Housing Markets (2025)

State Median Home Price
Iowa $228K
Ohio $241K
Oklahoma $244K
West Virginia $249K
Michigan $249K
Louisiana $249K
Arkansas $253K
Mississippi $253K
Indiana $255K
Missouri $258K

Sources & Notes

Home Price
Median sale prices for single-family residential properties.
Median Household Income
Middle household income value, with half of households earning more and half earning less.
Keep reading

Additional Rankings

Median Household Income By State
Economy
States

Median Household Income By State

Median Income By Country
Economy
Countries

Median Income By Country

Military Size By Country
Military
Countries

Military Size By Country

Millionaires By Country
Economy
Countries

Millionaires By Country

Missing Persons By State
Crime
States

Missing Persons By State

Moose Population by State

Moose Population by State