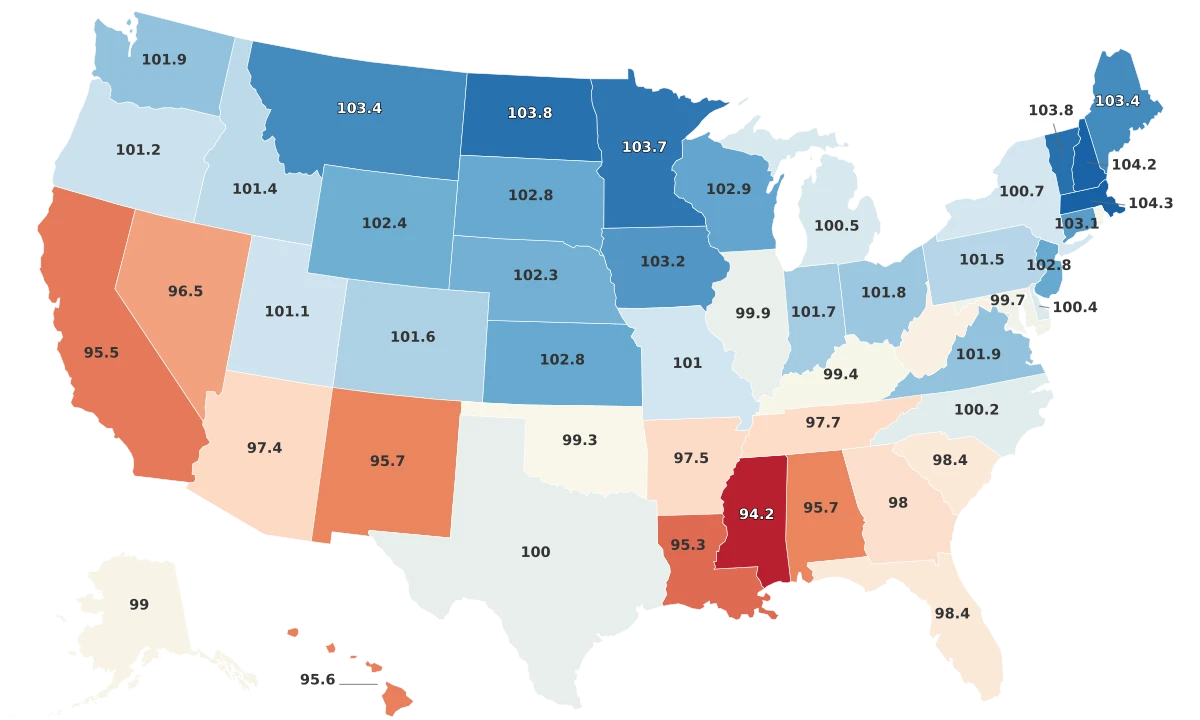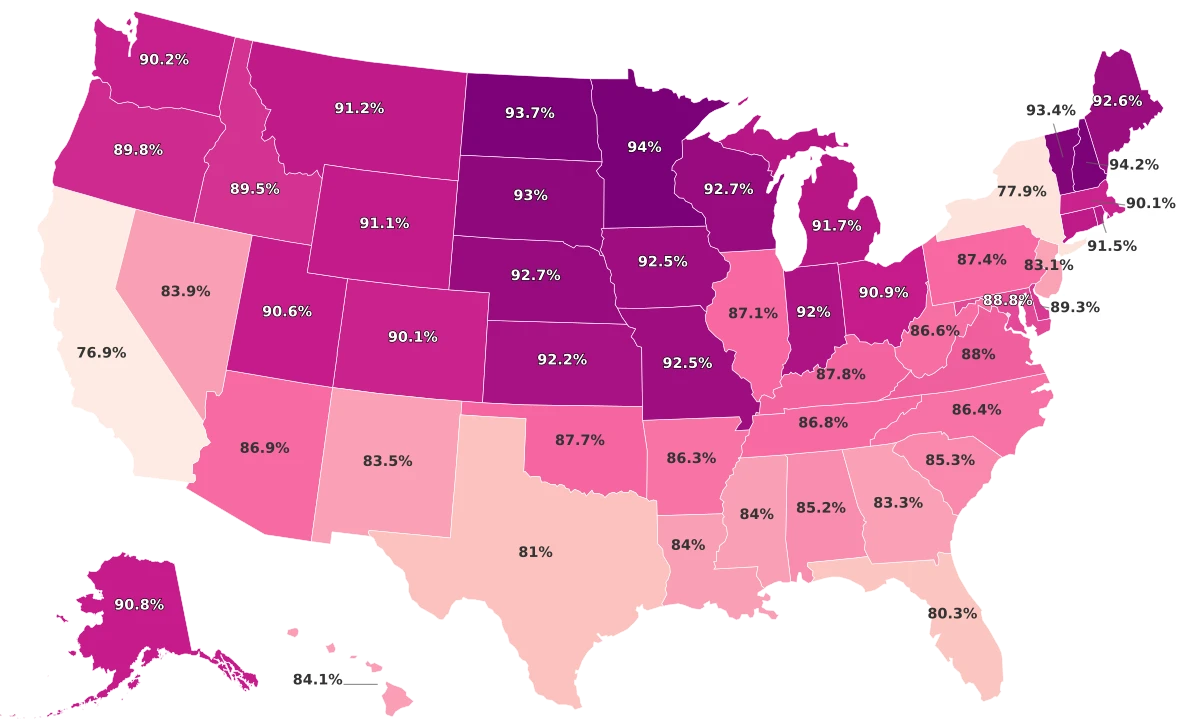
New Hampshire Leads at 94% and California Trails at 77%
The highest literacy rates in the country belong to small, northern states where nearly everyone grew up speaking English. New Hampshire leads at 94.2%. Minnesota follows at 94.0%, then North Dakota at 93.7% and Vermont at 93.4%. At the opposite end, California sits at 76.9% and New York at 77.9%, more than 16 points below the top. The gap between first and last place is 17.3 percentage points.
These rankings measure functional literacy in English: the ability to read, write, and use written information in everyday life. They are based on estimates derived from the National Center for Education Statistics (NCES), which models state-level adult literacy using survey data and demographic indicators from the American Community Survey.
Most states cluster tightly between 84% and 93%. The national mean is 88.3% and the median is 89.4%, meaning half the country sits above 89% and the distribution is fairly even. But the regional pattern is sharp. The Midwest averages 92.1%, the highest of any region. The Northeast averages 89.1%. The West sits at 87.6%. The South trails at 85.7%, more than 6 points behind the Midwest.
The states at the very bottom break away from that central cluster. California, New York, Florida (80.3%), and Texas (81.0%) all sit below 82%, and the reason has less to do with school quality than with who lives there.
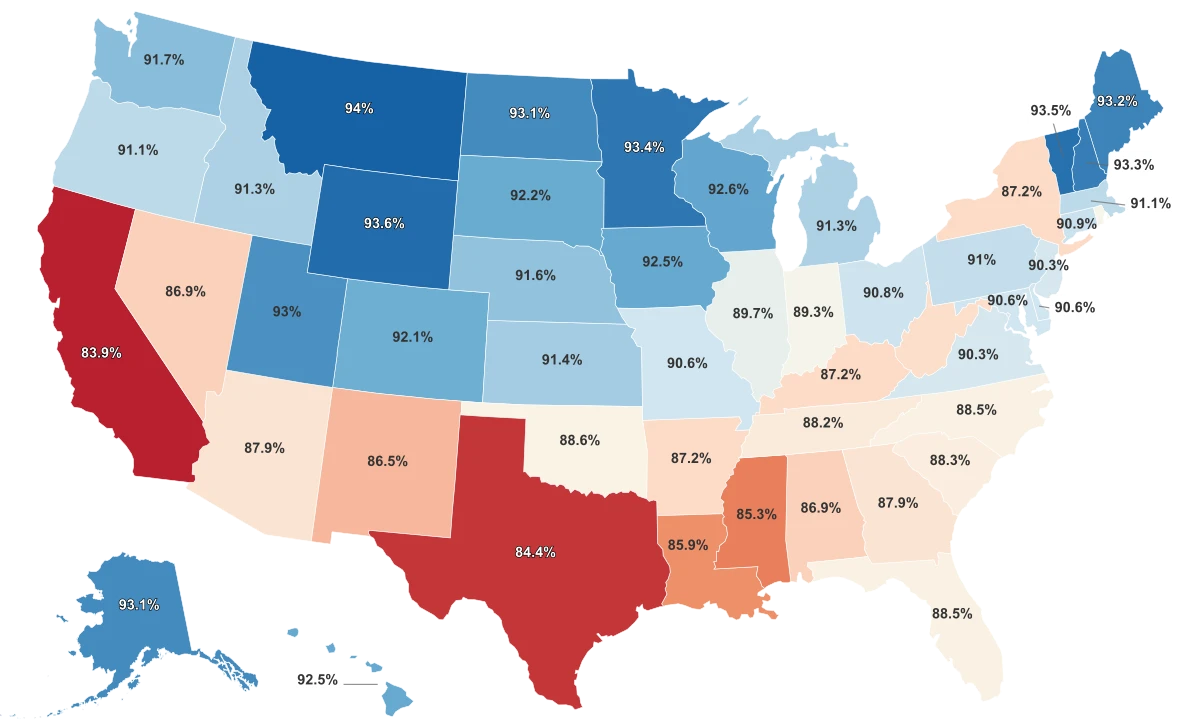
California and New York Are Outliers, and Language Is the Reason
California and New York are not just low. They are statistical outliers, sitting farther from the national average than any other states in the dataset. California's 76.9% is nearly 12 points below the mean. New York's 77.9% is more than 10 points behind.
The explanation is not that residents of these states cannot read. It is that many of them cannot read English. California has more than 10 million foreign-born residents, more than any other state. Over one million students in its K-12 system are classified as English Learners. New York has more than 4.5 million foreign-born residents. These populations may be fully literate in Spanish, Mandarin, Tagalog, or Korean, but they score low on assessments that measure only English-language proficiency.
Texas (81.0%) and Florida (80.3%) show the same pattern. Both rank in the bottom five for literacy and both have among the nation's largest immigrant populations. New Jersey is another example: its Education Score of 68 places it in the top tier for postsecondary attainment, yet its literacy rate of 83.1% sits near the bottom third. The foreign-born population in northern New Jersey is among the densest in the country.
The bottom of this ranking is not a map of bad schools. It is a map of where people who speak other languages live. That distinction matters, because these same states often lead the country in university graduation rates, research output, and economic productivity.
The Midwest-South Divide Goes Back Centuries
The 6.4-point gap between the Midwest (92.1% average literacy) and the South (85.7%) is the widest regional divide in the data. It shows up in high school completion too: the Midwest averages 91.5% while the South averages 87.9%. The same states appear near the bottom of both lists.
Mississippi (84.0%), Louisiana (84.0%), Alabama (85.2%), and South Carolina (85.3%) form a cluster at the lower end. The causes are structural and deeply historical. Before the Civil War, most Southern states had anti-literacy laws that explicitly prohibited enslaved people from learning to read. After the war, the South lagged in industrialization, which limited the tax base available for public schools. During the Jim Crow era, school systems for Black students were systematically underfunded for decades.
That legacy compounds. According to ProLiteracy, nearly 80% of adults living in poverty read at or below a basic level. Low literacy limits employment, which deepens poverty, which limits educational access for the next generation. The South has carried higher poverty rates than the Midwest for over a century, and the literacy gap tracks that divide almost perfectly.
There are signs of movement. Mississippi adopted the Literacy-Based Promotion Act in 2013, which required students to demonstrate reading proficiency before advancing past third grade and invested in teacher training around phonics-based instruction. Within a decade, the state climbed from near the bottom of national 4th-grade reading scores toward the middle. Its adult literacy rate (84.0%) has not yet reflected those gains, but the K-12 pipeline is shifting.
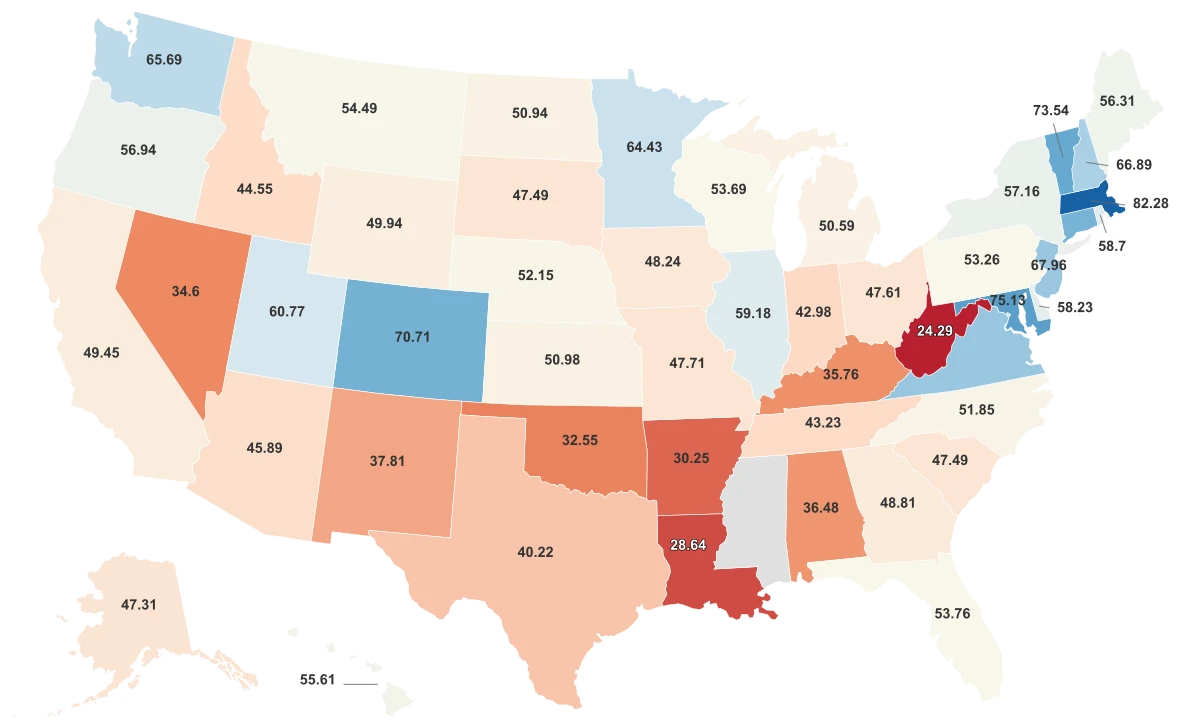
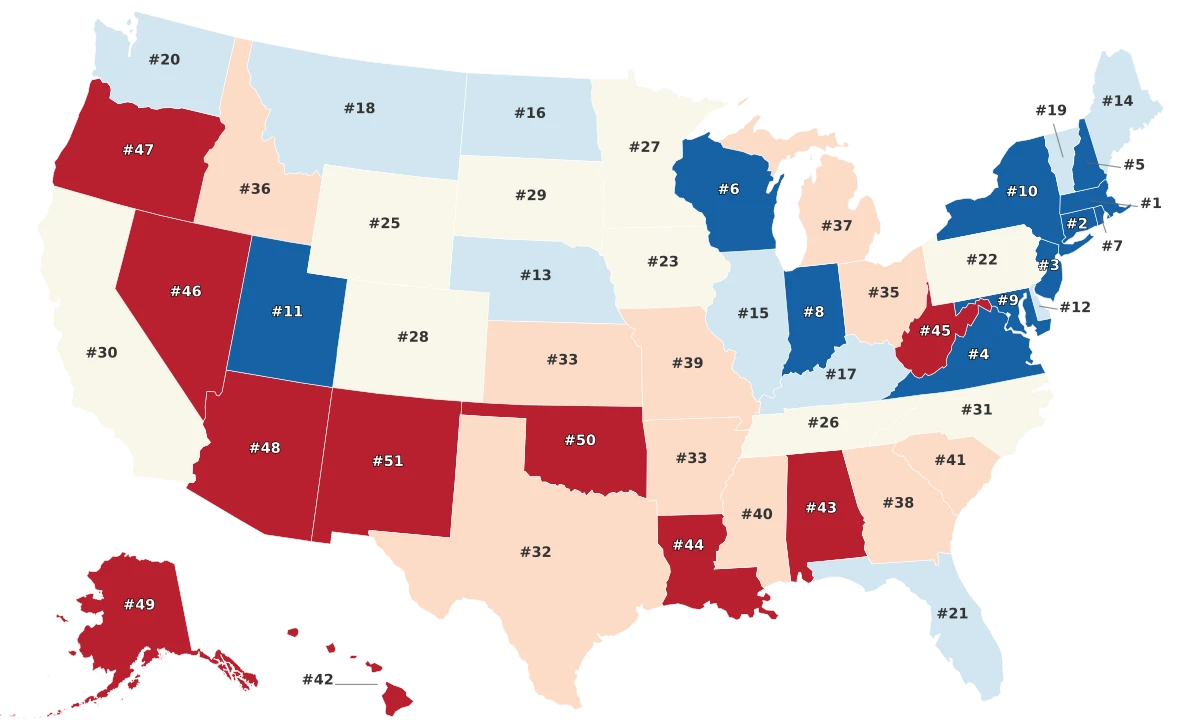
Massachusetts Ranks First in Education and Twenty-Third in Literacy
One of the most counterintuitive patterns in the data is how little literacy and education quality overlap. The correlation between Literacy Rate and Education Score across all 50 states is weak: the two metrics move almost independently of each other.
Literacy Rate and Education Score Move Almost Independently
States with high basic literacy often rank low in overall education quality, and vice versa, because the two metrics measure fundamentally different things.
Massachusetts leads the country in Education Score at 82.3, driven by the highest concentration of bachelor's and graduate degree holders in the nation. Harvard, MIT, and dozens of research universities anchor a highly educated workforce. But its literacy rate is 90.1%, placing it 23rd. That is not a contradiction. It is what happens when one metric weights postsecondary degrees and the other measures whether someone can read a bus schedule.
The reverse is just as revealing. Missouri has a literacy rate of 92.5%, good for the top 10. Its Education Score is 47.7, near the bottom half. Indiana follows the same pattern: 92.0% literacy, Education Score of 43.0. These states have English-speaking populations with high basic reading skills but lower rates of college attendance.
West Virginia is the most extreme case. Its Education Score of 24.3 is the lowest in the dataset by a wide margin, driven by the nation's lowest rate of bachelor's degree attainment. But its literacy rate is 86.6%, squarely in the middle of the pack. Most West Virginians can read. Fewer of them went to college. Those are different problems, and conflating them misreads the data.
These Numbers Measure English, Not Reading
The literacy rates in this ranking come from modeled estimates, not a direct test administered to every resident. The National Center for Education Statistics (NCES) produces state-level literacy estimates by combining data from the Program for the International Assessment of Adult Competencies (PIAAC) with demographic data from the American Community Survey. PIAAC defines literacy as the ability to understand, evaluate, and use written texts to participate in society and achieve personal goals.
The critical caveat is that PIAAC assesses literacy in English only. A resident of Los Angeles who reads a Spanish-language newspaper every morning, manages household finances, and communicates fluently in written Spanish would score poorly on this assessment if her English reading skills are limited. She is not illiterate. She is not English-literate, and that is what this metric captures.
The national picture has gotten worse by this measure. The 2023 PIAAC cycle found that 28% of U.S. adults ages 16 to 65 scored at Level 1 or below in English literacy, up from 19% in the 2012/2014 cycle. Level 1 means a person can perform only the most basic tasks, like locating a single piece of information in a short text. That increase reflects both a genuine decline in reading proficiency among some populations and the continued growth of the non-English-speaking population.
The states at the top of this ranking are there because they have low poverty, strong schools, and populations that overwhelmingly speak English at home. The states at the bottom are there because they have large numbers of residents who speak other languages. Both patterns are real. Neither tells the whole story about who can read.