Literacy Rate By Country

Global
88.17%Total Literacy RateGlobal Average
Male Literacy RateGlobal Average
Female Literacy RateGlobal Average
Years of SchoolingGlobal Average
Total Literacy Rate 2025Question Mark
Map visualization
27%100%
Compared to 2021
124
SlovakiaSlovakia
100%+0.4 (+0.4%)
1
NorwayNorway
100%
1
AndorraAndorra
100%
1
LiechtensteinLiechtenstein
100%
16
UzbekistanUzbekistan
100%+0.005 (+0.0%)
111
GuamGuam
100%+0.211 (+0.2%)
110
AzerbaijanAzerbaijan
100%+0.195 (+0.2%)
112
KazakhstanKazakhstan
100%+0.212 (+0.2%)
116
UkraineUkraine
100%+0.236 (+0.2%)
1
LuxembourgLuxembourg
100%
1
North KoreaNorth Korea
100%
117
GeorgiaGeorgia
100%+0.24 (+0.2%)
1
FinlandFinland
100%
1
GreenlandGreenland
100%
157
LatviaLatvia
99.9%+0.007 (+0.0%)
156
EstoniaEstonia
99.9%+0.076 (+0.1%)
154
BelarusBelarus
99.9%+0.178 (+0.2%)
1577
San MarinoSan Marino
99.9%+3.9 (+4.1%)
194
TajikistanTajikistan
99.8%+0.019 (+0.0%)
193
ArmeniaArmenia
99.8%+0.032 (+0.0%)
199
LithuaniaLithuania
99.8%-0.023 (-0.0%)
195
PolandPoland
99.8%+0.013 (+0.0%)
233
RussiaRussia
99.7%-0.02 (-0.0%)
232
SloveniaSlovenia
99.7%-0.015 (-0.0%)
231
TurkmenistanTurkmenistan
99.7%+0.007 (+0.0%)
231
CubaCuba
99.7%-0.011 (-0.0%)
275
MoldovaMoldova
99.6%+0.356 (+0.4%)
27
KyrgyzstanKyrgyzstan
99.6%+0.099 (+0.1%)
274
BarbadosBarbados
99.6%-0.1 (-0.1%)
301
CroatiaCroatia
99.4%+0.127 (+0.1%)
302
TongaTonga
99.4%+0.002 (+0.0%)
303
CyprusCyprus
99.4%+0.34 (+0.3%)
331
ItalyItaly
99.2%+0.184 (+0.2%)
3490
FijiFiji
99.1%+5.4 (+5.8%)
341
SamoaSamoa
99.1%+0.085 (+0.1%)
345
HungaryHungary
99.1%-0.281 (-0.3%)
371
SwedenSweden
99%
371
CanadaCanada
99%
3727
ArgentinaArgentina
99%+0.91 (+0.9%)
3740
AlbaniaAlbania
99%+1.45 (+1.5%)
371
SwitzerlandSwitzerland
99%
371
New ZealandNew Zealand
99%
37100
MicronesiaMicronesia
99%+10 (+11%)
371
JapanJapan
99%
371
MonacoMonaco
99%
371
United KingdomUnited Kingdom
99%
3720
MontenegroMontenegro
99%+0.28 (+0.3%)
371
BelgiumBelgium
99%
371
IcelandIceland
99%
37
TuvaluTuvalu
99%
371
DenmarkDenmark
99%
371
FranceFrance
99%
371
United StatesUnited States
99%
3717
Antigua and BarbudaAntigua and Barbuda
99%+0.05 (+0.1%)
37
Czech RepublicCzech Republic
99%
371
GermanyGermany
99%
3729
SerbiaSerbia
99%+0.997 (+1.0%)
371
AustraliaAustralia
99%
371
NetherlandsNetherlands
99%
3724
MongoliaMongolia
99%+0.632 (+0.6%)
371
IrelandIreland
99%
626
RomaniaRomania
98.9%+0.143 (+0.1%)
627
Cayman IslandsCayman Islands
98.9%+0.032 (+0.0%)
647
South KoreaSouth Korea
98.8%+0.834 (+0.9%)
645
UruguayUruguay
98.8%+0.358 (+0.4%)
663
SpainSpain
98.6%+0.485 (+0.5%)
6626
GrenadaGrenada
98.6%+2.6 (+2.7%)
6823
TaiwanTaiwan
98.5%+2.4 (+2.5%)
699
BulgariaBulgaria
98.4%+0.011 (+0.0%)
694
JordanJordan
98.4%+0.386 (+0.4%)
693
North MacedoniaNorth Macedonia
98.4%+0.556 (+0.6%)
7210
Marshall IslandsMarshall Islands
98.3%+0.035 (+0.0%)
7320
Trinidad and TobagoTrinidad and Tobago
98%-0.97 (-1.0%)
733
Costa RicaCosta Rica
98%+0.353 (+0.4%)
7321
BahrainBahrain
98%+2.28 (+2.4%)
735
ArubaAruba
98%+0.476 (+0.5%)
736
AustriaAustria
98%
7355
United Arab EmiratesUnited Arab Emirates
98%+5.01 (+5.4%)
7315
Bosnia and HerzegovinaBosnia and Herzegovina
98%-0.486 (-0.5%)
7312
PalestinePalestine
98%+1.33 (+1.4%)
8151
MaldivesMaldives
97.9%-1.42 (-1.4%)
8123
GreeceGreece
97.9%+2.61 (+2.7%)
833
IsraelIsrael
97.8%+0.7 (+0.7%)
842
BruneiBrunei
97.6%+0.943 (+1.0%)
8427
Saudi ArabiaSaudi Arabia
97.6%+2.76 (+2.9%)
862
SingaporeSingapore
97.5%+0.725 (+0.7%)
8616
VenezuelaVenezuela
97.5%+2.1 (+2.2%)
88
MacauMacau
97.1%
8916
Saint Kitts and NevisSaint Kitts and Nevis
97%-0.8 (-0.8%)
89
ChinaChina
97%+0.643 (+0.7%)
892
ChileChile
97%+0.372 (+0.4%)
897
Saint Vincent and the GrenadinesSaint Vincent and the Grenadines
97%+1.37 (+1.4%)
8910
American SamoaAmerican Samoa
97%-0.344 (-0.4%)
9411
New CaledoniaNew Caledonia
96.9%-0.038 (-0.0%)
95
TurkeyTurkey
96.7%+1.01 (+1.1%)
9670
PalauPalau
96.6%-2.92 (-2.9%)
977
KuwaitKuwait
96.5%+0.382 (+0.4%)
9810
PhilippinesPhilippines
96.3%-0.318 (-0.3%)
992
BahamasBahamas
96%+0.4 (+0.4%)
991
IndonesiaIndonesia
96%+0.562 (+0.6%)
101
PortugalPortugal
95.9%+0.472 (+0.5%)
1012
SeychellesSeychelles
95.9%+0.579 (+0.6%)
10314
VietnamVietnam
95.8%+1.29 (+1.4%)
1043
PanamaPanama
95.7%+0.662 (+0.7%)
10419
OmanOman
95.7%+1.73 (+1.8%)
1068
ColombiaColombia
95.6%+1.02 (+1.1%)
10724
Dominican RepublicDominican Republic
95.5%+3.03 (+3.3%)
1083
Equatorial GuineaEquatorial Guinea
95.3%+0.104 (+0.1%)
1096
MexicoMexico
95.2%+0.654 (+0.7%)
11010
LebanonLebanon
95%+0.949 (+1.0%)
1102
MalaysiaMalaysia
95%+0.363 (+0.4%)
1103
South AfricaSouth Africa
95%+0.402 (+0.4%)
110
NauruNauru
95%
11012
SurinameSuriname
95%-0.539 (-0.6%)
1154
MaltaMalta
94.9%+0.833 (+0.9%)
11616
Sao Tome and PrincipeSao Tome and Principe
94.8%+3.05 (+3.3%)
11713
BrazilBrazil
94.7%+2.11 (+2.3%)
11819
ParaguayParaguay
94.5%-1.04 (-1.1%)
118
PeruPeru
94.5%+0.126 (+0.1%)
1202
ThailandThailand
94.1%+0.117 (+0.1%)
12115
BoliviaBolivia
94%-1.14 (-1.2%)
1226
EcuadorEcuador
93.9%-0.615 (-0.7%)
12348
QatarQatar
93.5%-4.26 (-4.4%)
1242
Puerto RicoPuerto Rico
92.4%-0.929 (-1.0%)
1259
NamibiaNamibia
92.3%+1.48 (+1.6%)
1254
Sri LankaSri Lanka
92.3%-0.314 (-0.3%)
1278
MauritiusMauritius
92.2%+1.58 (+1.7%)
1287
DominicaDominica
92%-2 (-2.1%)
1294
LibyaLibya
91%-0.389 (-0.4%)
1309
Cape VerdeCape Verde
90.8%+2.33 (+2.6%)
13112
GuyanaGuyana
90%+2.46 (+2.8%)
1315
Saint LuciaSaint Lucia
90%-0.1 (-0.1%)
13111
El SalvadorEl Salvador
90%+2.35 (+2.7%)
13463
Ivory CoastIvory Coast
89.9%+46.63 (+108%)
13511
ZimbabweZimbabwe
89.7%+2.83 (+3.3%)
1369
MyanmarMyanmar
89.1%-3.99 (-4.3%)
13614
VanuatuVanuatu
89.1%+4.04 (+4.8%)
1386
EswatiniEswatini
89%+1.53 (+1.7%)
1387
IranIran
89%+1.83 (+2.1%)
1402
JamaicaJamaica
88.7%+0.2 (+0.2%)
141
BotswanaBotswana
88.5%+0.276 (+0.3%)
1411
HondurasHonduras
88.5%+0.075 (+0.1%)
14315
LaosLaos
88%+8.13 (+10%)
1445
ZambiaZambia
86.7%+1.58 (+1.9%)
1452
SyriaSyria
86.4%+0.096 (+0.1%)
1466
GabonGabon
86%+2.76 (+3.3%)
14712
IraqIraq
85.6%+5.88 (+7.4%)
14815
CambodiaCambodia
84%+5.65 (+7.2%)
14814
GuatemalaGuatemala
84%+4.93 (+6.2%)
1504
NicaraguaNicaragua
83%+0.528 (+0.6%)
15015
KenyaKenya
83%+4.98 (+6.4%)
1523
TunisiaTunisia
82.7%+1.65 (+2.0%)
1533
TanzaniaTanzania
82%+1.64 (+2.0%)
1538
LesothoLesotho
82%+2.64 (+3.3%)
1555
AlgeriaAlgeria
81.4%+1.79 (+2.3%)
15610
DR CongoDR Congo
81%+3.78 (+4.9%)
1563
BelizeBelize
81%-1.78 (-2.1%)
158
Republic of the CongoRepublic of the Congo
80.6%
1598
GhanaGhana
80%+3.42 (+4.5%)
16011
UgandaUganda
79%+5.19 (+7.0%)
1618
CameroonCameroon
78%+3.01 (+4.0%)
16219
MadagascarMadagascar
77.3%+12.64 (+20%)
16310
MoroccoMorocco
77%+5.29 (+7.4%)
16312
Solomon IslandsSolomon Islands
77%-7.1 (-8.4%)
1655
EritreaEritrea
76.6%+2.75 (+3.7%)
16618
BurundiBurundi
76%-9.5 (-11%)
1666
IndiaIndia
76%+3.77 (+5.2%)
1686
RwandaRwanda
75.9%+4.66 (+6.5%)
16915
BangladeshBangladesh
74.9%+13.41 (+22%)
1702
EgyptEgypt
73.1%-2.74 (-3.6%)
17111
BhutanBhutan
72%+8.09 (+13%)
1714
AngolaAngola
72%+0.836 (+1.2%)
1737
NepalNepal
71.2%+6.54 (+10%)
1742
YemenYemen
70.1%+0.138 (+0.2%)
175
Timor LesteTimor Leste
68.1%
1763
MalawiMalawi
68%+2.04 (+3.1%)
17716
MauritaniaMauritania
67%+14.88 (+29%)
178
TogoTogo
66.5%-0.038 (-0.1%)
1794
Papua New GuineaPapua New Guinea
64.2%+0.767 (+1.2%)
1808
MozambiqueMozambique
63.4%+4.56 (+7.8%)
1816
NigeriaNigeria
62%+2.43 (+4.1%)
18117
ComorosComoros
62%-16.14 (-21%)
1832
HaitiHaiti
61.7%+1.01 (+1.7%)
1845
SudanSudan
60.7%+2.1 (+3.6%)
1857
GambiaGambia
59%+3.43 (+6.2%)
1864
PakistanPakistan
58%+1.56 (+2.8%)
1865
SenegalSenegal
58%+2.38 (+4.3%)
1882
Guinea BissauGuinea Bissau
52.9%-6.87 (-11%)
1895
EthiopiaEthiopia
51.8%+2.77 (+5.6%)
1905
Sierra LeoneSierra Leone
48.6%+0.168 (+0.3%)
1915
LiberiaLiberia
48.3%+0.7 (+1.5%)
1927
BeninBenin
47%+8.55 (+22%)
1938
Burkina FasoBurkina Faso
46%+8.25 (+22%)
19411
GuineaGuinea
45.3%+14.83 (+49%)
1955
SomaliaSomalia
41%+3.2 (+8.5%)
19610
NigerNiger
38%+18.9 (+99%)
1975
Central African RepublicCentral African Republic
37.5%+0.747 (+2.0%)
198
AfghanistanAfghanistan
37.3%
1995
South SudanSouth Sudan
34.5%+2.52 (+7.9%)
2003
MaliMali
31%-2.07 (-6.3%)
2013
ChadChad
27%-13.02 (-33%)
Literacy Rate By Country
Share

Last updated March 31, 2026

More Than a Billion Adults Still Cannot Read

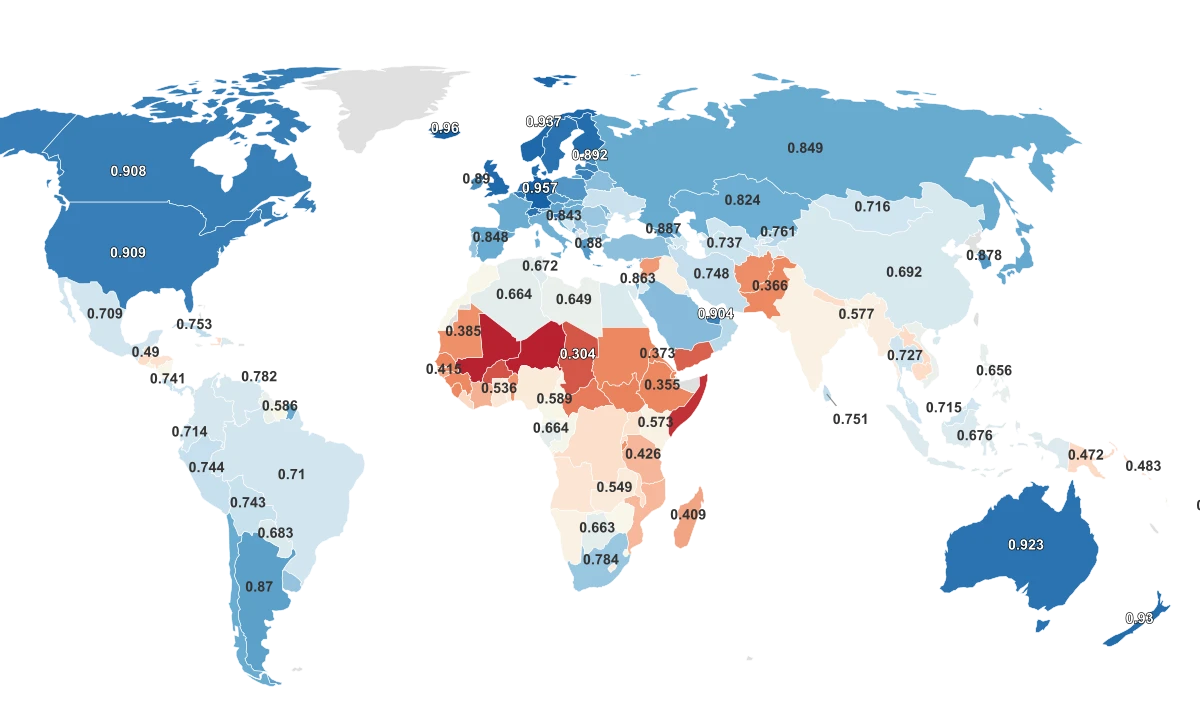
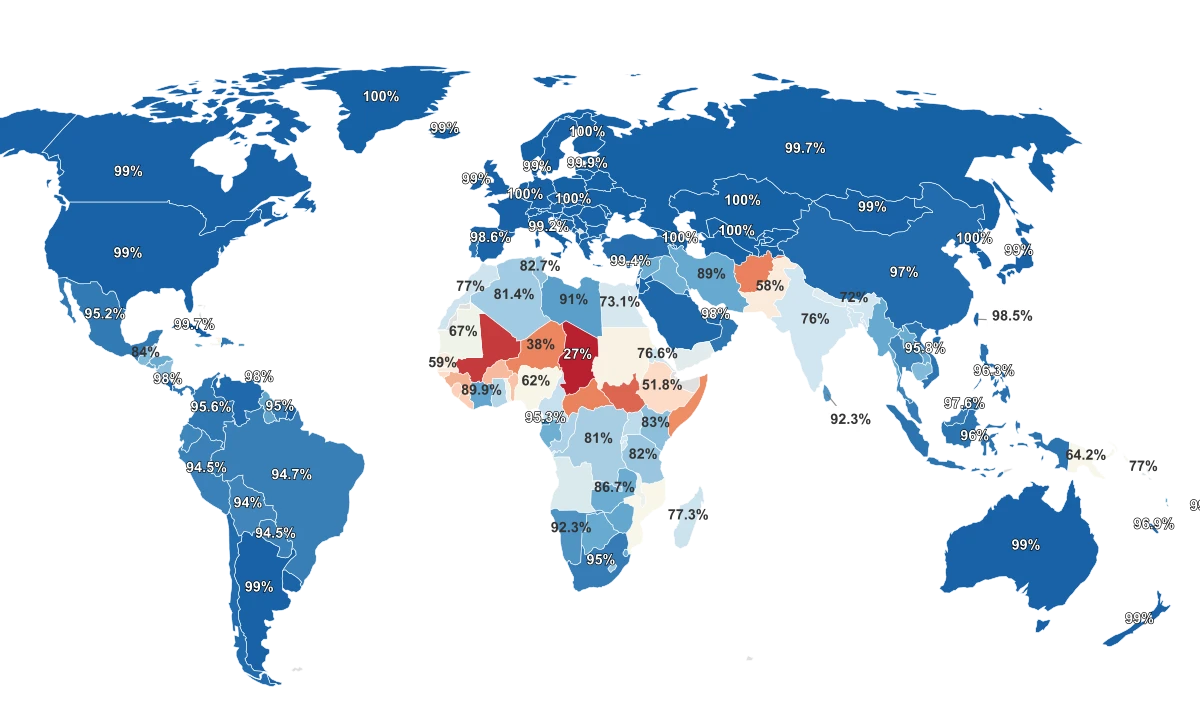
The World Bank defines adult literacy as the share of people aged 15 and above who can both read and write a short, simple statement about their everyday life. That sounds like a low bar. For most of the developed world, it is: 14 countries in this dataset report 100% literacy, including Norway, Finland, Slovakia, and Uzbekistan. Dozens more sit at 99%.

But the bottom of the ranking tells a different story. Chad reports a literacy rate of just 27%, meaning nearly three out of four adults cannot read a sentence. Mali sits at 31%. South Sudan at 34.5%. The gap between the top and bottom of this ranking is 73 percentage points, one of the widest in any human development metric.

The distribution is sharply lopsided. The median country sits at 95.9%, but the mean is dragged down to 88.2% by a cluster of low outliers almost entirely concentrated in Sub-Saharan Africa. Most of the world has crossed the 90% threshold. The crisis is concentrated in a narrow band of countries that have not.

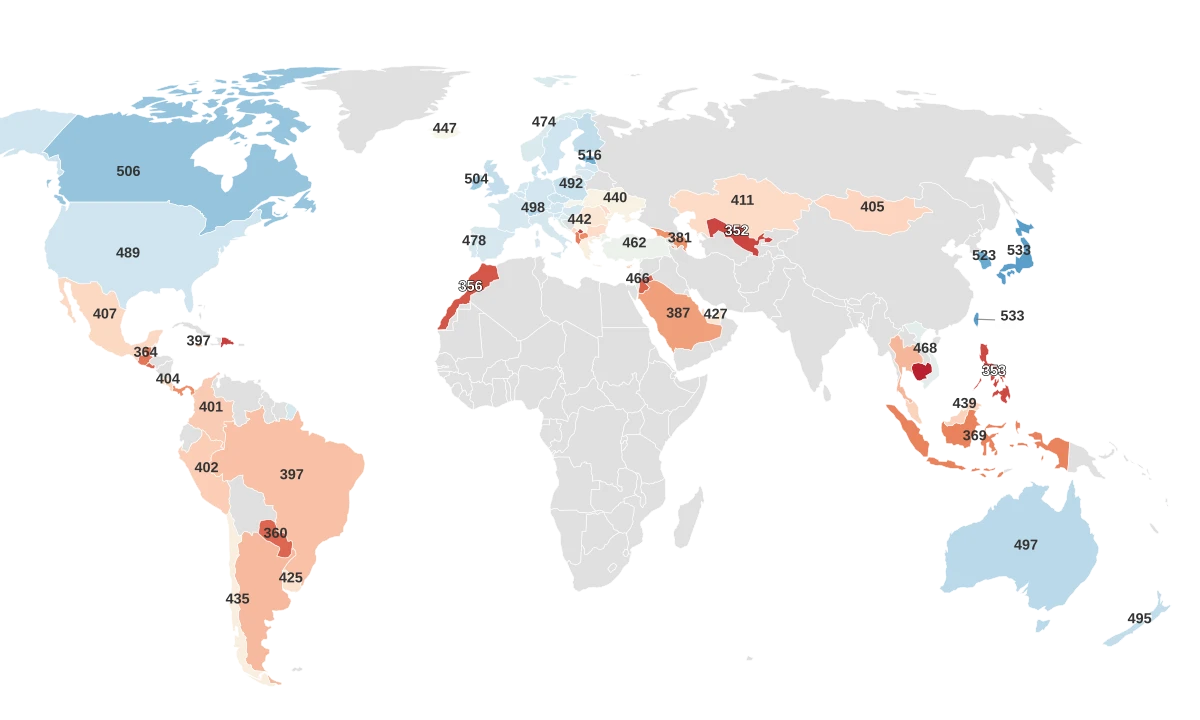
Most of the World Held Steady, but a Few Countries Surged

Total Literacy Rate change from 2021 to 2025. Ivory Coast more than doubled its reported rate while several countries saw modest declines.

Total Literacy Rate % 2021 → 2025 90% 92% 94% 96% 98% 100% Slovakia Norway Andorra Liechtenstein Uzbekistan Guam Azerbaijan Kazakhstan Ukraine Luxembourg Georgia Finland Greenland Latvia Estonia Belarus San Marino Tajikistan Armenia Lithuania Poland Russia Slovenia Turkmenistan Cuba Moldova Kyrgyzstan Barbados Croatia Tonga Cyprus Italy Fiji Samoa Hungary Sweden Canada Argentina Albania Switzerland New Zealand Micronesia Japan Monaco United Kingdom Montenegro Belgium Iceland Denmark France United States +0.4% 0% 0% 0% +0.0% +0.2% +0.2% +0.2% +0.2% 0% +0.2% 0% 0% +0.0% +0.1% +0.2% +3.9% +0.0% +0.0% 0.0% +0.0% 0.0% 0.0% +0.0% 0.0% +0.4% +0.1% 0.1% +0.1% +0.0% +0.3% +0.2% +5.4% +0.1% 0.3% 0% 0% +0.9% +1.4% 0% 0% +10% 0% 0% 0% +0.3% 0% 0% 0% 0% 0%

Showing 51 of 193 regions · Sorted by: Highest to Lowest · 142 not shown

The 2021-to-2025 comparison reveals a few dramatic movers. Ivory Coast jumped from 43.3% to 89.9%, a change driven by the government's introduction of compulsory free education for ages six to 16, expanded school infrastructure, and catch-up literacy programs under its National Development Plan. Niger nearly doubled its reported rate from 19.1% to 38%, though it remains the second-lowest in the dataset. On the other end, a handful of countries saw small declines, likely reflecting updated census methodologies rather than actual regression.

All Metrics

Region ↕Total Literacy Rate 2025↕Male Literacy Rate 2025↕Female Literacy Rate 2025↕Years of Schooling 2023↕
Slovakia100%
Norway100%
Andorra100%
Liechtenstein100%
Uzbekistan100%
Guam100%
Azerbaijan100%
Kazakhstan100%
Ukraine100%
Luxembourg100%
North Korea100%
Georgia100%
Finland100%
Greenland100%
Latvia99.9%
Estonia99.9%
Belarus99.9%
San Marino99.9%
Tajikistan99.8%
Armenia99.8%
Lithuania99.8%
Poland99.8%
Russia99.7%
Slovenia99.7%
Turkmenistan99.7%
Cuba99.7%
Moldova99.6%
Kyrgyzstan99.6%
Barbados99.6%
Croatia99.4%
Tonga99.4%
Cyprus99.4%
Italy99.2%
Fiji99.1%
Samoa99.1%
Hungary99.1%
Sweden99%
Canada99%
Argentina99%
Albania99%
Switzerland99%
New Zealand99%
Micronesia99%
Japan99%
Monaco99%
United Kingdom99%
Montenegro99%
Belgium99%
Iceland99%
Tuvalu99%
Denmark99%
France99%
United States99%
Antigua and Barbuda99%
Czech Republic99%
Germany99%
Serbia99%
Australia99%
Netherlands99%
Mongolia99%
Ireland99%
Romania98.9%
Cayman Islands98.9%
South Korea98.8%
Uruguay98.8%
Spain98.6%
Grenada98.6%
Taiwan98.5%
Bulgaria98.4%
Jordan98.4%
North Macedonia98.4%
Marshall Islands98.3%
Trinidad and Tobago98%
Costa Rica98%
Bahrain98%
Aruba98%
Austria98%
United Arab Emirates98%
Bosnia and Herzegovina98%
Palestine98%
Maldives97.9%
Greece97.9%
Israel97.8%
Brunei97.6%
Saudi Arabia97.6%
Singapore97.5%
Venezuela97.5%
Macau97.1%
Saint Kitts and Nevis97%
China97%
Chile97%
Saint Vincent and the Grenadines97%
American Samoa97%
New Caledonia96.9%
Turkey96.7%
Palau96.6%
Kuwait96.5%
Philippines96.3%
Bahamas96%
Indonesia96%
Portugal95.9%
Seychelles95.9%
Vietnam95.8%
Panama95.7%
Oman95.7%
Colombia95.6%
Dominican Republic95.5%
Equatorial Guinea95.3%
Mexico95.2%
Lebanon95%
Malaysia95%
South Africa95%
Nauru95%
Suriname95%
Malta94.9%
Sao Tome and Principe94.8%
Brazil94.7%
Paraguay94.5%
Peru94.5%
Thailand94.1%
Bolivia94%
Ecuador93.9%
Qatar93.5%
Puerto Rico92.4%
Namibia92.3%
Sri Lanka92.3%
Mauritius92.2%
Dominica92%
Libya91%
Cape Verde90.8%
Guyana90%
Saint Lucia90%
El Salvador90%
Ivory Coast89.9%
Zimbabwe89.7%
Myanmar89.1%
Vanuatu89.1%
Eswatini89%
Iran89%
Jamaica88.7%
Botswana88.5%
Honduras88.5%
Laos88%
Zambia86.7%
Syria86.4%
Gabon86%
Iraq85.6%
Cambodia84%
Guatemala84%
Nicaragua83%
Kenya83%
Tunisia82.7%
Tanzania82%
Lesotho82%
Algeria81.4%
DR Congo81%
Belize81%
Republic of the Congo80.6%
Ghana80%
Uganda79%
Cameroon78%
Madagascar77.3%
Morocco77%
Solomon Islands77%
Eritrea76.6%
Burundi76%
India76%
Rwanda75.9%
Bangladesh74.9%
Egypt73.1%
Bhutan72%
Angola72%
Nepal71.2%
Yemen70.1%
Timor Leste68.1%
Malawi68%
Mauritania67%
Togo66.5%
Papua New Guinea64.2%
Mozambique63.4%
Nigeria62%
Comoros62%
Haiti61.7%
Sudan60.7%
Gambia59%
Pakistan58%
Senegal58%
Guinea Bissau52.9%
Ethiopia51.8%
Sierra Leone48.6%
Liberia48.3%
Benin47%
Burkina Faso46%
Guinea45.3%
Somalia41%
Niger38%
Central African Republic37.5%
Afghanistan37.3%
South Sudan34.5%
Mali31%
Chad27%

The Sahel Is Ground Zero for the Global Literacy Crisis

If you drew a line across the Sahel, the semi-arid belt stretching from Senegal to Sudan, you would capture nearly every country at the bottom of this ranking. Chad (27%), Mali (31%), and South Sudan (34.5%) anchor the very bottom. Just above them, Afghanistan (37.3%), Central African Republic (37.5%), and Niger (38%) all fall below 40%.

Widen the lens slightly and the pattern holds. Somalia (41%), Guinea (45.3%), and Burkina Faso (46%) bring the total to nine countries below the halfway mark. Eight of those nine are in Sub-Saharan Africa.

The pattern is not random. It follows conflict, poverty, and the near-absence of functioning school systems. A 2022 Brookings Institution analysis found that the Sahel's overlapping crises, armed insurgencies, climate-driven displacement, and chronic government underfunding, have created what education researchers call "learning poverty": children who are technically enrolled in school but leave without basic reading or math skills.

Countries Where Children Stay in School Longer Have Higher Literacy Rates

Total Literacy Rate vs. Mean Years of Schooling across 190 countries, showing a tight relationship between education access and adult reading ability.

40% 60% 80% 100% 2 4 6 8 10 12 14 Total Literacy Rate % Years of Schooling Egypt China Nigeria Liberia Ivory Coast Burundi Senegal Chad

The scatter plot makes the connection visible. Niger, where adults average just 1.4 years of schooling, sits at the bottom of both axes. Mali averages 1.6 years. Chad averages 2.3. At the other end, Germany (14.3 years), Canada (13.9), and the United States (13.9) cluster near 100% literacy. The relationship is not perfect: Burundi reports 76% literacy despite averaging only 3.5 years of schooling, suggesting its census methodology may define literacy more loosely. But the overall pattern is unmistakable. Where children do not stay in school, adults cannot read.

The structural barriers are steep. In the Sahel, armed groups have forced thousands of schools to close. Teachers are scarce, especially outside cities. Families that depend on subsistence farming often cannot spare children for the classroom. And even when schools exist, they may lack walls, textbooks, or running water. The result is a cycle: low literacy limits economic productivity, which limits the tax revenue available to fund schools, which keeps literacy low.

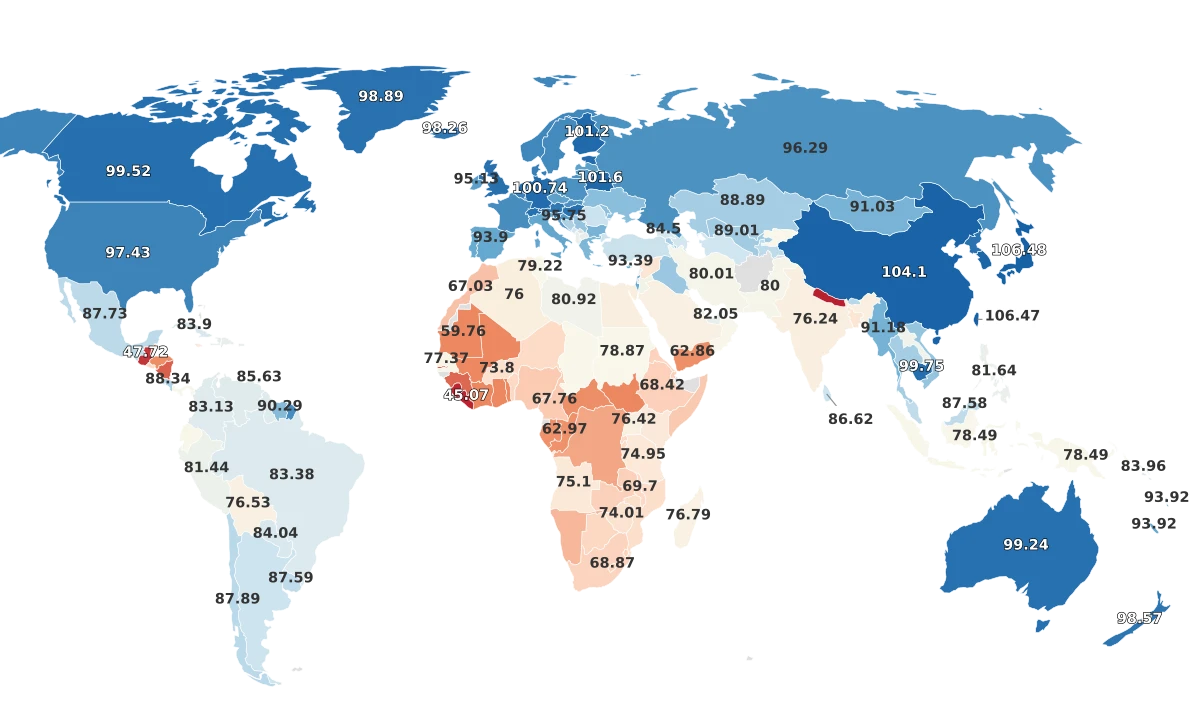
The Countries Where Women Are Shut Out

The gap between male and female literacy rates is one of the starkest inequalities in the dataset. In Yemen, men read at 85.1% while women read at 55%. That is a 30.1 percentage-point gap. In Guinea, the gap is 29.9 points. In Afghanistan, it is 29.5 points: 52.1% of men can read, but only 22.6% of women, the lowest female literacy rate of any country in the dataset.

Afghanistan is the only country in the world that has formally banned girls from attending secondary school and university. The Taliban's decree, imposed after the 2021 takeover, reversed two decades of progress. According to UNESCO, 78% of young Afghan women are now neither in education, employment, nor training. The country's female literacy rate, already among the lowest before the ban, is almost certain to fall further as a generation of girls grows up without access to classrooms.

The gender divide elsewhere in the bottom of the rankings reflects a different set of barriers. In Chad, female literacy is just 18.2%, compared to 35.4% for men. In Mali, the split is 25.7% versus 46.2%. In these countries, the gap is driven less by policy bans and more by the economics of poverty: when families can only afford to send one child to school, sons are prioritized. Early marriage pulls girls out of education, particularly in rural areas. And a shortage of female teachers discourages families from enrolling daughters in the first place.

But the gender gap is not universal, and it does not always favor men. In Jamaica, women are more literate than men by 9.1 percentage points: 93.1% to 84%. Malta shows a 3-point female advantage. Qatar, Philippines, Namibia, and Zimbabwe all report higher female than male literacy. In much of the Caribbean and parts of Southeast Asia, girls outperform boys in school enrollment and completion, a pattern that is beginning to reverse the traditional direction of the gap.

Asking "Can You Read?" Does Not Mean the Same Thing Everywhere

Every number in this ranking comes from the same source: the World Bank's compilation of national literacy statistics, drawn primarily from population censuses and household surveys. But the way countries collect that data varies enormously, and those differences matter more than most readers realize.

The most common method is a simple question in a national census: "Can you read and write?" The respondent, or sometimes the head of the household answering on behalf of everyone, says yes or no. This self-reporting approach is cheap and scalable, but it consistently overestimates literacy. People tend to say they can read even when their skills are minimal, and household heads may over-report for family members.

A second approach skips the question entirely and infers literacy from years of schooling. If a person completed a certain grade level, they are counted as literate. The threshold varies wildly. According to UNESCO, Greece considers anyone who has completed six years of primary education to be literate. Paraguay sets the bar at just two years. As Our World in Data notes, "schooling does not produce literacy the same way everywhere," and in many lower-income countries, a large share of students who complete primary school still cannot read a simple paragraph.

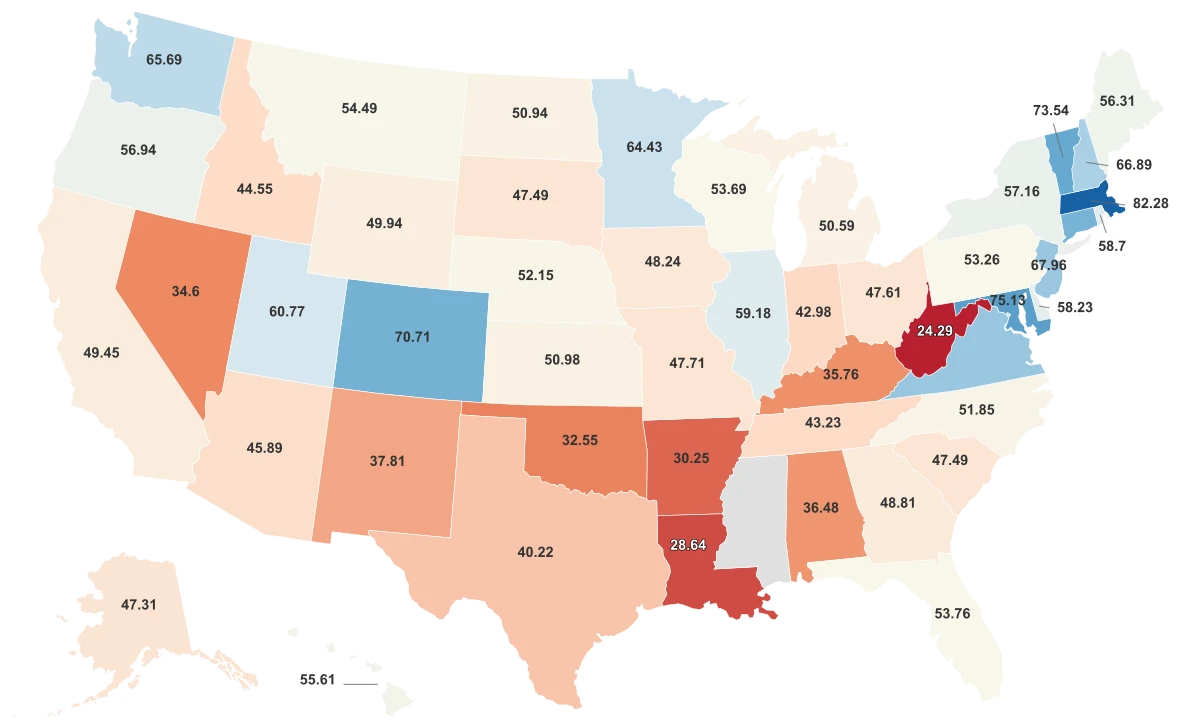
The practical consequence is that the 99% literacy rates reported by most wealthy nations, including the United States, United Kingdom, and Germany, are not based on anyone actually taking a reading test. They are estimates derived from educational attainment data. When countries like the U.S. do conduct direct literacy assessments, the results are more nuanced: a 2020 National Center for Education Statistics survey found that roughly 21% of American adults read at or below a basic level, a figure that never appears in the international literacy statistics. The 99% and the 21% are measuring different things, and both are true at the same time.

Sources & Notes

Total Literacy Rate

% of the total adult population (ages 15 and above) who can both read and write short, simple statements in their everyday life.

Male Literacy Rate

% of the total male population (ages 15 and above) who can both read and write short, simple statements in their everyday life.

Female Literacy Rate

% of the total female population (ages 15 and above) who can both read and write short, simple statements in their everyday life.

Years of Schooling

Average number of years of education received by people ages 25 and older, converted from education attainment levels using official durations of each level.

Keep reading

Additional Rankings

Dumbest Countries
Education
Countries

Dumbest Countries

Education Rankings by Country
Education
Countries

Education Rankings by Country

Smartest Countries
Education
Countries

Smartest Countries

Average IQ by Country
Education
Countries

Average IQ by Country

PISA Scores By Country
Education
Countries

PISA Scores By Country

Least Educated States
Education
States

Least Educated States