Life Expectancy By Country

GlobalGlobal
74.12 yearsLife ExpectancyGlobal Average
76.74 yearsFemale Life ExpectancyGlobal Average
71.54 yearsMale Life ExpectancyGlobal Average
77.75Bloomberg Global Health IndexGlobal Average
Life Expectancy 2024Question Mark
Map visualization
54.6 years86.5 years
Compared to 2023
1
MonacoMonaco
86.5years
21
San MarinoSan Marino
85.8years+0.1 (+0.1%)
3
Hong KongHong Kong
85.6years
42
JapanJapan
84.8years+0.1 (+0.1%)
52
South KoreaSouth Korea
84.4years+0.1 (+0.1%)
5
Saint BarthelemySaint Barthelemy
84.4years
73
AndorraAndorra
84.2years+0.2 (+0.2%)
7
French PolynesiaFrench Polynesia
84.2years
95
SwitzerlandSwitzerland
84.1years+0.1 (+0.1%)
93
AustraliaAustralia
84.1years+0.2 (+0.2%)
114
SingaporeSingapore
83.9years+0.2 (+0.2%)
114
ItalyItaly
83.9years+0.2 (+0.2%)
136
SpainSpain
83.8years+0.1 (+0.1%)
133
LiechtensteinLiechtenstein
83.8years+0.2 (+0.2%)
15
ReunionReunion
83.7years
16
GibraltarGibraltar
83.6years
176
MaltaMalta
83.5years+0.2 (+0.2%)
176
NorwayNorway
83.5years+0.2 (+0.2%)
176
FranceFrance
83.5years+0.2 (+0.2%)
209
SwedenSweden
83.4years+0.1 (+0.1%)
21
MacauMacau
83.2years
22
Vatican CityVatican City
83.1years
227
United Arab EmiratesUnited Arab Emirates
83.1years+0.2 (+0.2%)
248
IcelandIceland
83years+0.3 (+0.4%)
258
CanadaCanada
82.7years+0.1 (+0.1%)
25
MartiniqueMartinique
82.7years
257
IsraelIsrael
82.7years+0.3 (+0.4%)
2810
IrelandIreland
82.6years+0.2 (+0.2%)
2911
PortugalPortugal
82.5years+0.1 (+0.1%)
29
BermudaBermuda
82.5years
2911
QatarQatar
82.5years+0.1 (+0.1%)
3210
LuxembourgLuxembourg
82.4years+0.2 (+0.2%)
339
BelgiumBelgium
82.3years+0.2 (+0.2%)
3311
NetherlandsNetherlands
82.3years+0.1 (+0.1%)
3511
New ZealandNew Zealand
82.2years+0.1 (+0.1%)
35
GuadeloupeGuadeloupe
82.2years
3710
DenmarkDenmark
82.1years+0.2 (+0.2%)
3711
AustriaAustria
82.1years+0.1 (+0.1%)
3710
FinlandFinland
82.1years+0.2 (+0.2%)
4013
GreeceGreece
82years+0.1 (+0.1%)
41
Puerto RicoPuerto Rico
81.9years
4212
SloveniaSlovenia
81.8years+0.2 (+0.2%)
4212
CyprusCyprus
81.8years+0.2 (+0.2%)
4411
United KingdomUnited Kingdom
81.5years+0.2 (+0.2%)
4412
GermanyGermany
81.5years+0.1 (+0.1%)
4611
ChileChile
81.4years+0.2 (+0.2%)
4613
BahrainBahrain
81.4years+0.1 (+0.1%)
4812
MaldivesMaldives
81.3years+0.3 (+0.4%)
49
Isle Of ManIsle Of Man
81.1years
5013
Costa RicaCosta Rica
81years+0.2 (+0.2%)
5113
KuwaitKuwait
80.6years+0.2 (+0.2%)
52
Cayman IslandsCayman Islands
80.5years
53
Saint MartinSaint Martin
80.4years
5415
OmanOman
80.3years+0.3 (+0.4%)
5515
Czech RepublicCzech Republic
80years+0.2 (+0.3%)
5615
PanamaPanama
79.8years+0.2 (+0.3%)
5615
AlbaniaAlbania
79.8years+0.2 (+0.3%)
58
AnguillaAnguilla
79.5years
5815
United StatesUnited States
79.5years+0.2 (+0.3%)
6016
EstoniaEstonia
79.3years+0.1 (+0.1%)
61
Northern Mariana IslandsNorthern Mariana Islands
79years
6116
Saudi ArabiaSaudi Arabia
79years+0.3 (+0.4%)
63
New CaledoniaNew Caledonia
78.9years
6418
CroatiaCroatia
78.8years+0.2 (+0.3%)
6418
PolandPoland
78.8years+0.2 (+0.3%)
6618
SlovakiaSlovakia
78.5years+0.2 (+0.3%)
6718
UruguayUruguay
78.3years+0.2 (+0.3%)
6718
CubaCuba
78.3years+0.2 (+0.3%)
69
Turks and Caicos IslandsTurks and Caicos Islands
78.2years
7017
LebanonLebanon
78years+0.2 (+0.3%)
7019
ChinaChina
78years
7018
Bosnia and HerzegovinaBosnia and Herzegovina
78years+0.1 (+0.1%)
7017
JordanJordan
78years+0.2 (+0.3%)
7419
PeruPeru
77.9years+0.2 (+0.3%)
7419
ColombiaColombia
77.9years+0.2 (+0.3%)
7621
IranIran
77.8years+0.1 (+0.1%)
7618
Antigua and BarbudaAntigua and Barbuda
77.8years+0.2 (+0.3%)
7819
Sri LankaSri Lanka
77.7years+0.2 (+0.3%)
7919
EcuadorEcuador
77.6years+0.2 (+0.3%)
8020
ArgentinaArgentina
77.5years+0.1 (+0.1%)
8020
North MacedoniaNorth Macedonia
77.5years+0.1 (+0.1%)
82
British Virgin IslandsBritish Virgin Islands
77.4years
8219
TurkeyTurkey
77.4years+0.2 (+0.3%)
82
GuamGuam
77.4years
8521
MontenegroMontenegro
77.3years+0.2 (+0.3%)
86
French GuianaFrench Guiana
77.2years
8621
HungaryHungary
77.2years+0.2 (+0.3%)
88
CuracaoCuracao
77years
89
Saint Pierre and MiquelonSaint Pierre and Miquelon
76.9years
8923
SerbiaSerbia
76.9years+0.1 (+0.1%)
9124
MalaysiaMalaysia
76.8years+0.1 (+0.1%)
9224
TunisiaTunisia
76.7years+0.2 (+0.3%)
9324
ThailandThailand
76.6years+0.2 (+0.3%)
94
ArubaAruba
76.5years
9424
AlgeriaAlgeria
76.5years+0.2 (+0.3%)
96
MontserratMontserrat
76.3years
9625
LatviaLatvia
76.3years+0.1 (+0.1%)
9625
BarbadosBarbados
76.3years+0.1 (+0.1%)
99
MayotteMayotte
76.2years
9926
Cape VerdeCape Verde
76.2years+0.1 (+0.1%)
9925
LithuaniaLithuania
76.2years+0.2 (+0.3%)
10227
RomaniaRomania
76.1years+0.2 (+0.3%)
10327
BrazilBrazil
76years+0.2 (+0.3%)
10427
ArmeniaArmenia
75.8years+0.1 (+0.1%)
10426
BulgariaBulgaria
75.8years+0.2 (+0.3%)
10627
MoroccoMorocco
75.5years+0.2 (+0.3%)
106
Cook IslandsCook Islands
75.5years
10627
BruneiBrunei
75.5years+0.2 (+0.3%)
10928
GrenadaGrenada
75.4years+0.2 (+0.3%)
11028
MexicoMexico
75.3years+0.2 (+0.3%)
11128
NicaraguaNicaragua
75.1years+0.2 (+0.3%)
11128
MauritiusMauritius
75.1years+0.2 (+0.3%)
11328
BangladeshBangladesh
74.9years+0.2 (+0.3%)
11428
BahamasBahamas
74.7years+0.1 (+0.1%)
11428
VietnamVietnam
74.7years+0.1 (+0.1%)
11417
UkraineUkraine
74.7years+1.3 (+1.8%)
11426
GeorgiaGeorgia
74.7years+0.2 (+0.3%)
11829
AzerbaijanAzerbaijan
74.6years+0.2 (+0.3%)
11829
BelarusBelarus
74.6years+0.2 (+0.3%)
12031
KazakhstanKazakhstan
74.5years+0.1 (+0.1%)
12129
ParaguayParaguay
74years+0.2 (+0.3%)
12229
Dominican RepublicDominican Republic
73.9years+0.2 (+0.3%)
12329
SurinameSuriname
73.8years+0.2 (+0.3%)
124
North KoreaNorth Korea
73.7years
12430
BelizeBelize
73.7years+0.1 (+0.1%)
12630
Trinidad and TobagoTrinidad and Tobago
73.6years+0.1 (+0.1%)
12728
BhutanBhutan
73.3years+0.3 (+0.4%)
12729
RussiaRussia
73.3years+0.1 (+0.1%)
12929
TongaTonga
73.1years+0.2 (+0.3%)
13030
SeychellesSeychelles
73years+0.1 (+0.1%)
13030
HondurasHonduras
73years+0.1 (+0.1%)
130
American SamoaAmerican Samoa
73years
13330
Saint LuciaSaint Lucia
72.8years+0.1 (+0.1%)
13329
GuatemalaGuatemala
72.8years+0.2 (+0.3%)
13530
VenezuelaVenezuela
72.7years+0.2 (+0.3%)
13628
SyriaSyria
72.6years+0.5 (+0.7%)
13731
UzbekistanUzbekistan
72.5years+0.1 (+0.1%)
13831
IraqIraq
72.4years+0.1 (+0.1%)
13931
Saint Kitts and NevisSaint Kitts and Nevis
72.3years+0.2 (+0.3%)
13931
El SalvadorEl Salvador
72.3years+0.2 (+0.3%)
14130
IndiaIndia
72.2years+0.2 (+0.3%)
14229
MongoliaMongolia
72years+0.3 (+0.4%)
14331
TajikistanTajikistan
71.9years+0.1 (+0.1%)
14428
EgyptEgypt
71.8years+0.2 (+0.3%)
14431
SamoaSamoa
71.8years+0.1 (+0.1%)
14431
KyrgyzstanKyrgyzstan
71.8years+0.1 (+0.1%)
14730
VanuatuVanuatu
71.7years+0.2 (+0.3%)
148
Western SaharaWestern Sahara
71.6years
14831
JamaicaJamaica
71.6years+0.1 (+0.1%)
15031
Saint Vincent and the GrenadinesSaint Vincent and the Grenadines
71.4years+0.2 (+0.3%)
15132
MoldovaMoldova
71.3years+0.1 (+0.1%)
15130
IndonesiaIndonesia
71.3years+0.2 (+0.3%)
15130
DominicaDominica
71.3years+0.2 (+0.3%)
15424
LibyaLibya
71.1years+1.8 (+2.6%)
15532
CambodiaCambodia
70.8years+0.1 (+0.1%)
15632
Solomon IslandsSolomon Islands
70.7years+0.2 (+0.3%)
15732
NepalNepal
70.6years+0.2 (+0.3%)
15832
GuyanaGuyana
70.3years+0.1 (+0.1%)
15932
TurkmenistanTurkmenistan
70.2years+0.1 (+0.1%)
159
GreenlandGreenland
70.2years
161
NiueNiue
70.1years
16234
PhilippinesPhilippines
70years+0.2 (+0.3%)
16334
Sao Tome and PrincipeSao Tome and Principe
69.9years+0.2 (+0.3%)
16434
YemenYemen
69.4years+0.1 (+0.1%)
16434
PalauPalau
69.4years+0.1 (+0.1%)
16633
BotswanaBotswana
69.3years+0.1 (+0.1%)
16733
LaosLaos
69.2years+0.2 (+0.3%)
1673
PalestinePalestine
69.2years+4 (+6.1%)
16934
SenegalSenegal
68.9years+0.2 (+0.3%)
16933
EritreaEritrea
68.9years+0.3 (+0.4%)
17133
MauritaniaMauritania
68.7years+0.2 (+0.3%)
17135
BoliviaBolivia
68.7years+0.1 (+0.1%)
17334
UgandaUganda
68.5years+0.2 (+0.3%)
17334
GabonGabon
68.5years+0.2 (+0.3%)
17534
RwandaRwanda
68years+0.2 (+0.3%)
17634
Timor LesteTimor Leste
67.9years+0.2 (+0.3%)
17734
PakistanPakistan
67.8years+0.2 (+0.3%)
17834
MalawiMalawi
67.6years+0.2 (+0.3%)
17832
EthiopiaEthiopia
67.6years+0.3 (+0.4%)
18034
FijiFiji
67.5years+0.2 (+0.3%)
18036
NamibiaNamibia
67.5years+0.1 (+0.1%)
18234
MicronesiaMicronesia
67.4years+0.2 (+0.3%)
18334
TuvaluTuvalu
67.3years+0.2 (+0.3%)
18434
TanzaniaTanzania
67.2years+0.2 (+0.3%)
18534
Marshall IslandsMarshall Islands
67.1years+0.2 (+0.3%)
18534
MyanmarMyanmar
67.1years+0.2 (+0.3%)
18734
ComorosComoros
67years+0.2 (+0.3%)
18834
KiribatiKiribati
66.6years+0.1 (+0.2%)
18934
ZambiaZambia
66.5years+0.2 (+0.3%)
18934
SudanSudan
66.5years+0.2 (+0.3%)
19132
AfghanistanAfghanistan
66.3years+0.3 (+0.5%)
19134
South AfricaSouth Africa
66.3years+0.2 (+0.3%)
19134
Papua New GuineaPapua New Guinea
66.3years+0.2 (+0.3%)
19435
DjiboutiDjibouti
66.2years+0.2 (+0.3%)
19534
GambiaGambia
66.1years+0.2 (+0.3%)
19634
Republic of the CongoRepublic of the Congo
66years+0.2 (+0.3%)
19734
GhanaGhana
65.7years+0.2 (+0.3%)
19833
HaitiHaiti
65.1years+0.2 (+0.3%)
19933
AngolaAngola
64.8years+0.2 (+0.3%)
20033
EswatiniEswatini
64.3years+0.2 (+0.3%)
20033
Guinea BissauGuinea Bissau
64.3years+0.2 (+0.3%)
20233
CameroonCameroon
64years+0.3 (+0.5%)
20334
Equatorial GuineaEquatorial Guinea
63.9years+0.2 (+0.3%)
20432
MozambiqueMozambique
63.8years+0.2 (+0.3%)
20432
MadagascarMadagascar
63.8years+0.2 (+0.3%)
20432
KenyaKenya
63.8years+0.2 (+0.3%)
20435
BurundiBurundi
63.8years+0.1 (+0.2%)
20833
ZimbabweZimbabwe
63.1years+0.3 (+0.5%)
20933
TogoTogo
62.9years+0.2 (+0.3%)
21033
LiberiaLiberia
62.3years+0.1 (+0.2%)
21032
NauruNauru
62.3years+0.2 (+0.3%)
21233
DR CongoDR Congo
62.1years+0.2 (+0.3%)
21233
Ivory CoastIvory Coast
62.1years+0.2 (+0.3%)
21433
Sierra LeoneSierra Leone
62years+0.2 (+0.3%)
21533
NigerNiger
61.4years+0.2 (+0.3%)
21633
Burkina FasoBurkina Faso
61.3years+0.2 (+0.3%)
21733
BeninBenin
61years+0.2 (+0.3%)
21833
GuineaGuinea
60.9years+0.2 (+0.3%)
21933
MaliMali
60.7years+0.3 (+0.5%)
22033
SomaliaSomalia
59years+0.2 (+0.3%)
22132
LesothoLesotho
57.8years+0.4 (+0.7%)
22233
Central African RepublicCentral African Republic
57.7years+0.3 (+0.5%)
22234
South SudanSouth Sudan
57.7years+0.1 (+0.2%)
22433
ChadChad
55.2years+0.1 (+0.2%)
22533
NigeriaNigeria
54.6years+0.1 (+0.2%)
Life Expectancy By Country
Share

Last updated February 28, 2026

Life Expectancy Globally

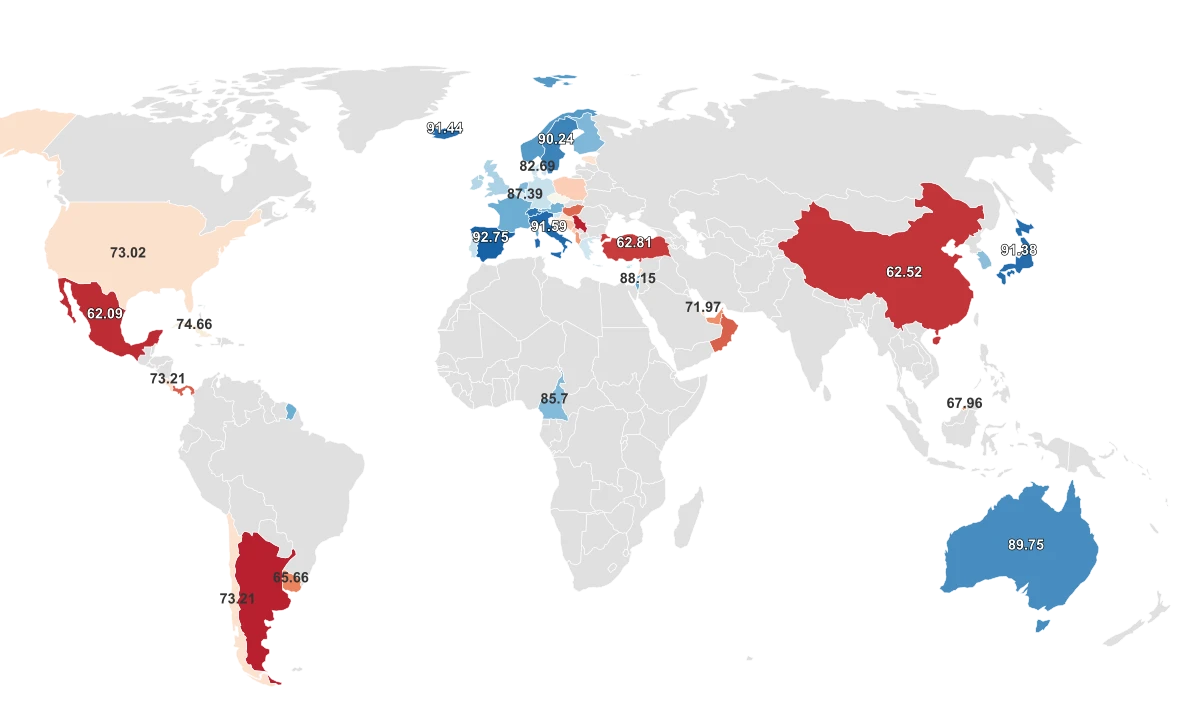
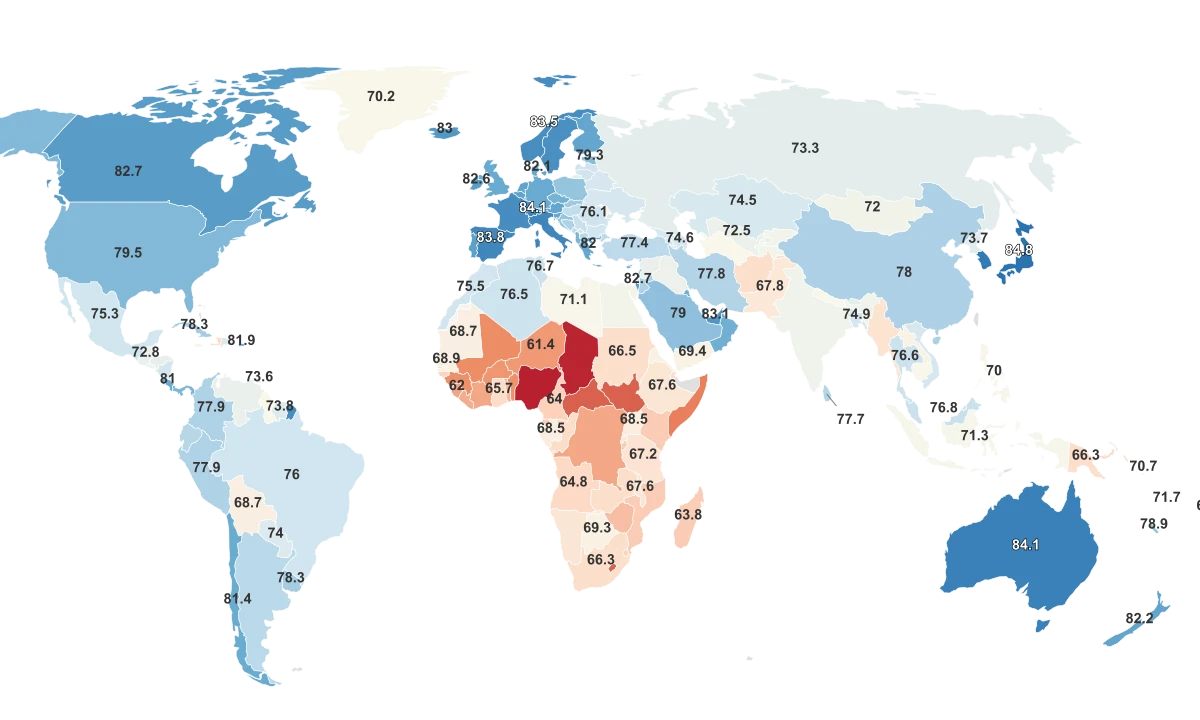
The measure of 'life expectancy' not only indicates the average age a person is expected to live but offers a crucial insight into the overall health and living standards of a country. It is influenced by a variety of factors including healthcare accessibility, nutritional standards, living conditions, and socio-economic factors. The World Health Organization and other international bodies regularly compile, analyze, and publish data on life expectancy to monitor global health trends. Interestingly, as per the data, the United States ranks relatively low in the list of countries by life expectancy, coming in at 58th place with a life expectancy of 79.74 years, despite being one of the world's most developed nations. A myriad of factors including healthcare costs, obesity rates, and socioeconomic disparities contribute to this ranking. Key findings from the data include:

  • Monaco leads the world with the highest life expectancy at 87.01 years, closely followed by Hong Kong (85.83 years) and Macau (85.51 years). This can be attributed to their high-quality healthcare, affluent lifestyles, and low levels of pollution.
  • In contrast, Chad has the lowest life expectancy at a mere 53.68 years due to ongoing conflict, high levels of poverty, and limited access to quality healthcare.
  • Many high-income countries such as Japan (84.95 years), Switzerland (84.38 years), and Singapore (84.27 years) feature in the top ten countries for life expectancy, underscoring the correlation between wealth and long lifespan.
  • However, it's noteworthy that a high GDP does not necessarily guarantee a long life span, as seen in the case of the United States.
  • Disparities between lower and higher-income countries remain stark, with a difference of 33.33 years between the nations with the highest and lowest life expectancies. This unique lens of life expectancy provides an avenue to explore the effects of countries' public health policies, socio-economic conditions, and lifestyle choices while pointing out critical areas for potential improvement. The journey towards equitable global health is ongoing, and these insights prove valuable in informing and shaping that trajectory.

All Metrics

Region ↕Life Expectancy 2024↕Female Life Expectancy 2024↕Male Life Expectancy 2024↕Bloomberg Global Health Index↕
Monaco86.588.684.6
San Marino85.887.284.3
Hong Kong85.688.383
Japan84.887.981.891.38
South Korea84.487.381.385.41
Saint Barthelemy84.486.981.6
Andorra84.286.282.3
French Polynesia84.286.681.9
Switzerland84.18682.290.93
Australia84.185.582.389.75
Singapore83.986.481.489.29
Italy83.985.981.891.59
Spain83.886.481.192.75
Liechtenstein83.885.482
Reunion83.786.580.7
Gibraltar83.686.281
Malta83.585.481.581.70
Norway83.58581.989.09
France83.586.280.686.94
Sweden83.485.281.790.24
Macau83.285.381
Vatican City83.185.281
United Arab Emirates83.184.382.267.14
Iceland8384.581.691.44
Canada82.784.980.5
Martinique82.785.779.5
Israel82.784.780.788.15
Ireland82.684.680.684.06
Portugal82.585.379.783.10
Bermuda82.585.979.1
Qatar82.583.581.871.97
Luxembourg82.483.980.887.39
Belgium82.384.580.180.46
Netherlands82.383.880.785.86
New Zealand82.283.980.6
Guadeloupe82.285.778.3
Denmark82.18480.282.69
Austria82.184.579.886.30
Finland82.184.879.485.89
Greece8284.579.582.29
Puerto Rico81.985.478.3
Slovenia81.884.579.182.72
Cyprus81.883.879.883.58
United Kingdom81.583.379.584.28
Germany81.583.979.283.06
Chile81.483.279.573.21
Bahrain81.482.180.872.31
Maldives81.3838070.95
Isle Of Man81.183.279
Costa Rica8183.678.473.21
Kuwait80.68279.5
Cayman Islands80.58378.2
Saint Martin80.48477
Oman80.38278.764.07
Czech Republic8082.877.277.59
Panama79.882.776.964.01
Albania79.881.677.968.04
Anguilla79.582.876.2
United States79.5827773.02
Estonia79.383.275.173.32
Northern Mariana Islands7980.977.3
Saudi Arabia7981.377.3
New Caledonia78.981.476.5
Croatia78.881.875.673.36
Poland78.882.575.170.25
Slovakia78.581.775.2
Uruguay78.38274.465.66
Cuba78.380.775.974.66
Turks and Caicos Islands78.280.576
Lebanon7879.975.970.53
China788175.362.52
Bosnia and Herzegovina7881.174.769.66
Jordan7880.375.9
Peru77.980.375.6
Colombia77.980.675.2
Iran77.879.876
Antigua and Barbuda77.880.574.7
Sri Lanka77.780.874.5
Ecuador77.680.374.9
Argentina77.5807561.19
North Macedonia77.579.775.3
British Virgin Islands77.480.274.7
Turkey77.480.374.662.81
Guam77.481.673.7
Montenegro77.380.573.969.69
French Guiana77.280.274.3
Hungary77.280.373.964.43
Curacao778172.7
Saint Pierre and Miquelon76.981.673
Serbia76.980.273.760.99
Malaysia76.879.574.5
Tunisia76.779.374.1
Thailand76.68172.3
Aruba76.578.973.8
Algeria76.577.975.1
Montserrat76.37974.3
Latvia76.380.671.8
Barbados76.378.873.8
Mayotte76.278.574.3
Cape Verde76.279.473
Lithuania76.280.871.4
Romania76.179.772.6
Brazil7679.273
Armenia75.879.671.6
Bulgaria75.879.472.3
Morocco75.577.873.3
Cook Islands75.579.272.1
Brunei75.577.773.567.96
Grenada75.478.572.5
Mexico75.37872.462.09
Nicaragua75.177.672.5
Mauritius75.178.372.1
Bangladesh74.976.773.3
Bahamas74.778.371.1
Vietnam74.779.470
Ukraine74.779.469.8
Georgia74.779.269.8
Azerbaijan74.677.371.7
Belarus74.679.269.7
Kazakhstan74.578.570.3
Paraguay7477.171
Dominican Republic73.977.170.7
Suriname73.87770.6
North Korea73.775.971.5
Belize73.776.771.1
Trinidad and Tobago73.676.870.5
Bhutan73.375.371.6
Russia73.379.267.5
Tonga73.176.569.5
Seychelles7376.770.1
Honduras7375.770.5
American Samoa737670.3
Saint Lucia72.876.569.5
Guatemala72.87570.4
Venezuela72.776.768.9
Syria72.674.970.2
Uzbekistan72.575.569.6
Iraq72.474.270.5
Saint Kitts and Nevis72.376.268.7
El Salvador72.376.567.8
India72.273.970.7
Mongolia7276.767.5
Tajikistan71.974.169.7
Egypt71.87469.7
Samoa71.873.870
Kyrgyzstan71.875.468.3
Vanuatu71.774.169.6
Western Sahara71.673.869.9
Jamaica71.674.269.1
Saint Vincent and the Grenadines71.474.568.8
Moldova71.375.766.7
Indonesia71.373.469.2
Dominica71.374.768.3
Libya71.172.769.6
Cambodia70.873.468.2
Solomon Islands70.772.269.4
Nepal70.672.169.1
Guyana70.374.166.6
Turkmenistan70.27367
Greenland70.272.668.2
Niue70.172.967.5
Philippines707367
Sao Tome and Principe69.973.966.4
Yemen69.471.567.4
Palau69.471.967.3
Botswana69.371.866.8
Laos69.271.567
Palestine69.274.365.2
Senegal68.97167
Eritrea68.970.966.8
Mauritania68.770.766.7
Bolivia68.771.366.3
Uganda68.571.465.5
Gabon68.571.266.1
Rwanda6870.165.7
Timor Leste67.969.766.3
Pakistan67.870.365.5
Malawi67.670.864.3
Ethiopia67.67164.3
Fiji67.569.565.5
Namibia67.571.563.5
Micronesia67.471.363.6
Tuvalu67.370.963.9
Tanzania67.27064.4
Marshall Islands67.169.565
Myanmar67.170.464
Comoros6769.265
Kiribati66.668.364.7
Zambia66.568.964.1
Sudan66.569.863.5
Afghanistan66.367.864.7
South Africa66.369.862.8
Papua New Guinea66.369.263.8
Djibouti66.268.763.7
Gambia66.167.864.3
Republic of the Congo6667.764.3
Ghana65.768.263.3
Haiti65.168.561.9
Angola64.867.362.3
Eswatini64.367.161.3
Guinea Bissau64.366.561.8
Cameroon6466.261.885.70
Equatorial Guinea63.965.962.2
Mozambique63.866.760.5
Madagascar63.865.662.1
Kenya63.866.161.6
Burundi63.865.961.8
Zimbabwe63.165.360.5
Togo62.963.162.7
Liberia62.363.661
Nauru62.364.260.4
DR Congo62.164.260
Ivory Coast62.164.360.2
Sierra Leone6263.760.2
Niger61.462.460.5
Burkina Faso61.363.459.1
Benin6162.459.5
Guinea60.962.159.7
Mali60.762.159.3
Somalia5961.556.5
Lesotho57.860.455
Central African Republic57.759.655.5
South Sudan57.760.854.8
Chad55.257.253.4
Nigeria54.654.954.3

Countries With Highest Life Expectancy

Among the world's countries, Monaco, Hong Kong, Macau, Japan, Liechtenstein, Switzerland, Singapore, Italy, Vatican City, and South Korea come out on top in terms of life expectancy. Topping off the list is Monaco with an impressive average life expectancy of 87.01 years. Following closely in second place is Hong Kong, with citizens expected to live an average of 85.83 years. Macau comes in third place with an impressive average life expectancy of 85.51 years, closely followed by Japan with 84.95 years. Next on the list is Liechtenstein with an average life expectancy of 84.77 years, Switzerland with 84.38 years, Singapore with 84.27 years, and Italy with 84.20 years. The Vatican City also demonstrates high life expectancy figures with an average of 84.16 years. Lastly, South Korea rounds up the top ten with an average life expectancy of 84.14 years. 10 Countries with Highest Life Expectancy:

  1. Monaco - 87.01 years
  2. Hong Kong - 85.83 years
  3. Macau - 85.51 years
  4. Japan - 84.95 years
  5. Liechtenstein - 84.77 years
  6. Switzerland - 84.38 years
  7. Singapore - 84.27 years
  8. Italy - 84.20 years
  9. Vatican City - 84.16 years
  10. South Korea - 84.14 years

Countries With Lowest Life Expectancies

The countries with the lowest life expectancies span the continents of Africa with Chad, Nigeria, Lesotho, Central African Republic, South Sudan, Somalia, Eswatini (Swaziland), Namibia, Guinea, and Mali rounding off the bottom ten. Chad has the lowest life expectancy of all, with an average of just 53.68 years. Close behind is Nigeria with a life expectancy of 53.87 years. The small country of Lesotho, surrounded by South Africa, reports a life expectancy of 54.91 years. Central African Republic has a life expectancy of 55.48 years, while South Sudan reports an average life expectancy of 56.51 years. Other countries in this list include Somalia, with an average life expectancy of 57.35 years and Eswatini (Swaziland) with a life expectancy of 57.71 years. Namibia and Guinea have slightly higher life expectancies of 59.53 and 59.55 years respectively, with Mali rounding off this list with a life expectancy of 60.03 years. 10 Countries With Lowest Life Expectancies:

  1. Chad - 53.68 years
  2. Nigeria - 53.87 years
  3. Lesotho - 54.91 years
  4. Central African Republic - 55.48 years
  5. South Sudan - 56.51 years
  6. Somalia - 57.35 years
  7. Eswatini (Swaziland) - 57.71 years
  8. Namibia - 59.53 years
  9. Guinea - 59.55 years
  10. Mali - 60.03 years While many factors can contribute to these low life expectancies, pervasive issues typically include poor access to quality healthcare, social instability, malnutrition, and high prevalence of diseases.

Sources & Notes

Life Expectancy

Average number of years a newborn is expected to live.

Female Life Expectancy

Average number of years a woman is expected to live.

Male Life Expectancy

Average number of years a man is expected to live.

Keep reading

Additional Rankings

Life Expectancy By State
Health
States

Life Expectancy By State

Literacy Rate By Country
Education
Countries

Literacy Rate By Country

Literacy Rate By State
Education
States

Literacy Rate By State

Male To Female Ratio By State

Male To Female Ratio By State

Meat Consumption By Country
Miscellaneous
Countries

Meat Consumption By Country

Median Home Price By State
Economy
States

Median Home Price By State