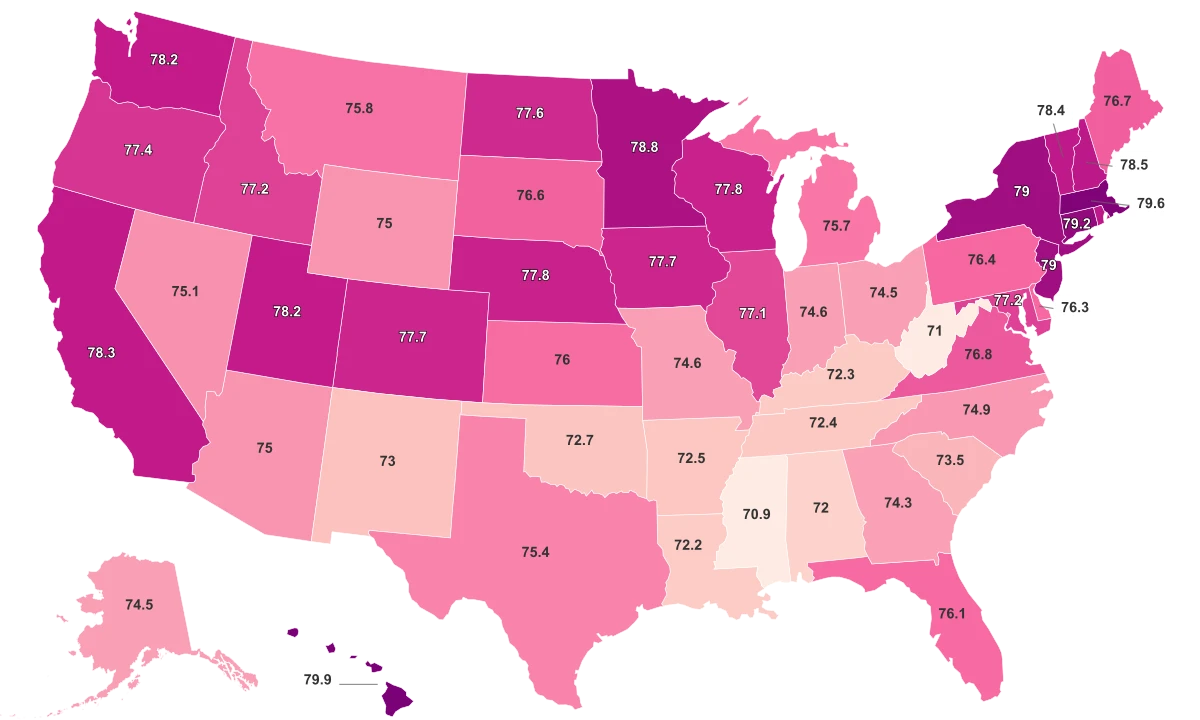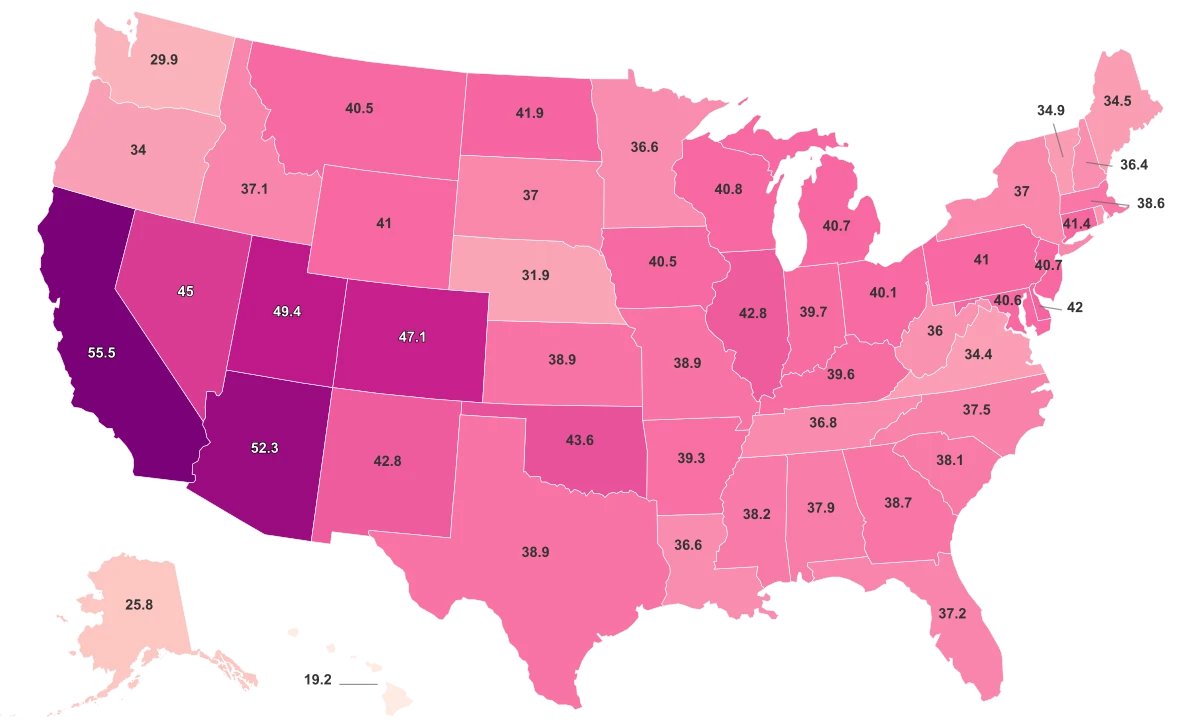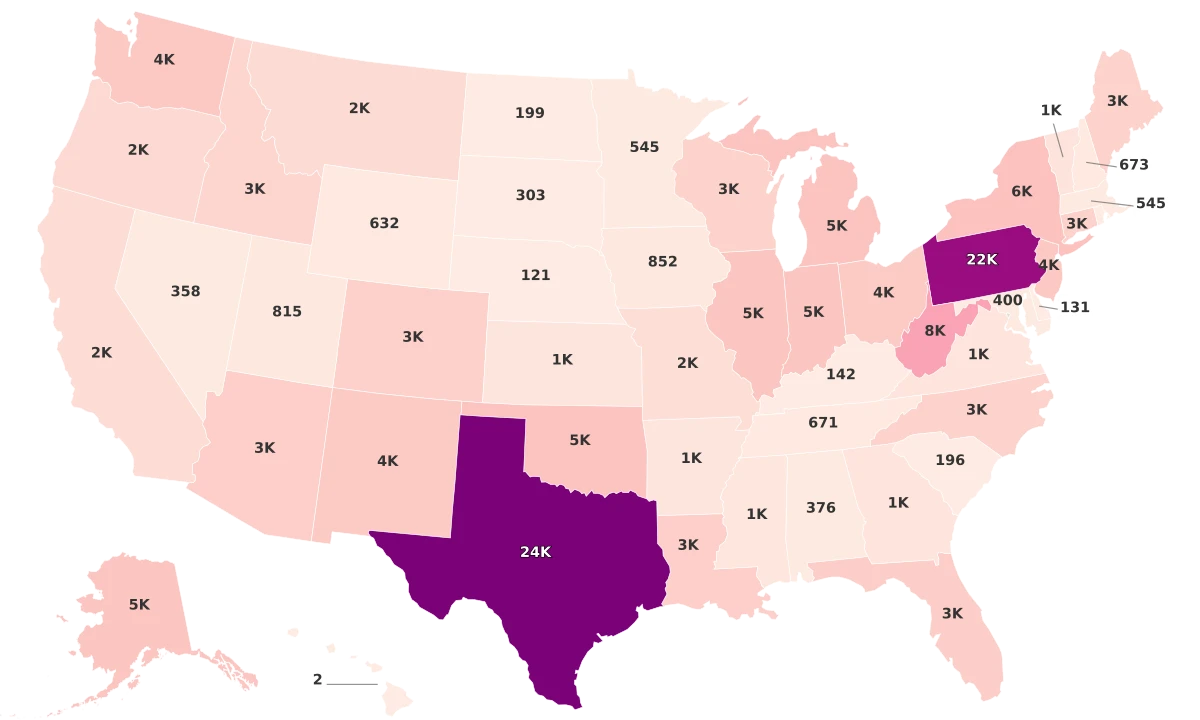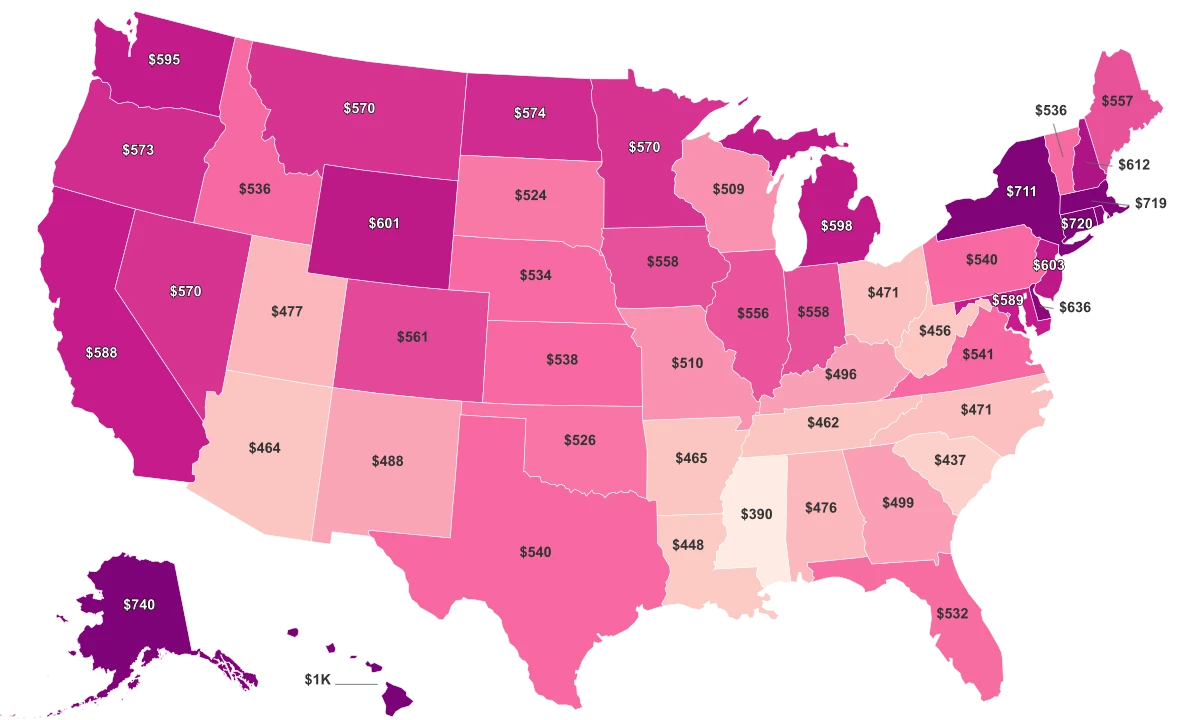
HIV Across The States
Human immunodeficiency virus (HIV) is a life-changing diagnosis that continues to impact thousands of people across the United States each year. This disease, characterized by a persistent attack on the immune system, is a vital public health issue necessitating prioritized attention, given its potential to evolve to acquired immunodeficiency syndrome (AIDS) if left untreated. With an estimated 1.14 million Americans living with HIV in 2016 and an annual diagnosis of about 37,832 in 2018, the importance of understanding the distribution of this endemic across the states cannot be overstated.
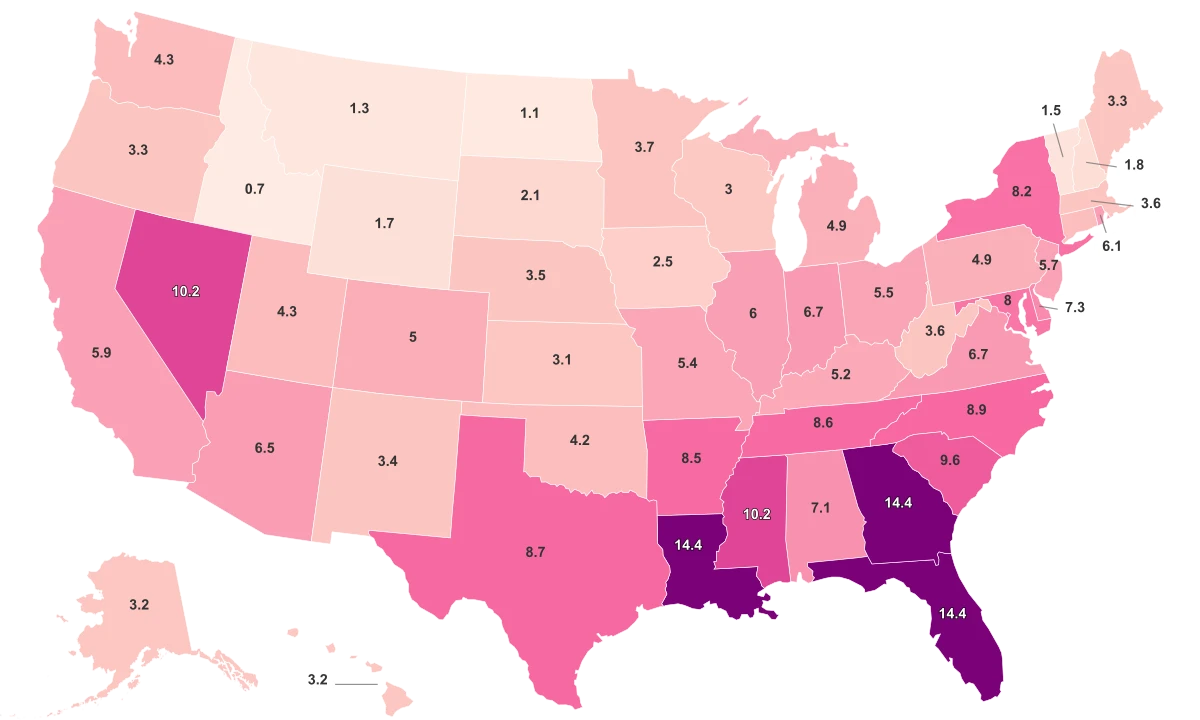
- The Southern States show a significantly higher rate of HIV diagnoses. Georgia leads the pack with a rate of 26.2 per 100k, followed by Louisiana (23.3), Florida (21.7), and Mississippi (17.0).
- On the other end of the spectrum, states like Wyoming (1.4), Vermont (2.1), and Montana (2.0) have the lowest rates of HIV diagnoses.
- The variances in diagnosis rates across states may also reflect differences in state laws related to HIV and other STDs, with potentially higher diagnosis rates in states that criminalize behaviors that can expose others to HIV.
States with the Highest HIV Rates
Leading in first place is Georgia, with a substantially high diagnosis rate of 26.2 per 100,000, followed by Louisiana at 23.3 per 100,000. Florida showing a slightly lower yet still concerning rate of 21.7 per 100,000 takes up the third spot. As we move further down the list, Nevada lands in the fourth place with 19.0 per 100,000 people, whereas Texas shows a rate of 18.0 per 100,000. Mississippi, North Carolina, South Carolina, Alabama, and New Jersey, holding the places from six to ten respectively, report moderately-high HIV diagnoses rates ranging from 14.6 to 17.0 per 100,000 people. States with the Highest HIV rates per 100K people:
- Georgia - 26.2
- Louisiana - 23.3
- Florida - 21.7
- Nevada - 19.0
- Texas - 18.0
- Mississippi - 17.0
- North Carolina - 16.0
- South Carolina - 15.0
- Alabama - 14.7
- New Jersey - 14.6
States with the Lowest HIV Rates
Topping the list with the lowest HIV rate per 100,000 people is Wyoming, with a profile of 1.4 cases per 100K. This low diagnosis rate is significant, and various factors such as population density, behavioral patterns, and potentially effective prevention programs might contribute to the result seen in this state. Vermont and Montana fall second and third, with HIV diagnosis rates of 2.1 and 2.0 per 100k population, respectively. Placed fourth and fifth are New Hampshire, and Maine which post HIV rates of 3.0 and 2.6 per 100k, respectively. Their figures resonate with the general trend of lower HIV rates in these northern, more rural states. Further down the list we find Idaho, South Dakota, Iowa, Utah, and Alaska, with HIV diagnosis rates ranging from 3.4 to 5.0 per 100k people. States with the Highest HIV Rates (per 100K people):
- Wyoming - 1.4
- Vermont - 2.1
- Montana - 2.0
- New Hampshire - 3.0
- Maine - 2.6
- Idaho - 3.4
- South Dakota - 4.2
- Iowa - 4.6
- Utah - 5.0
- Alaska - 5.0