Introduction
The Hispanic population is a significant and vibrant part of the cultural tapestry of the United States. Currently, the United States is home to more than 60 million Hispanics, comprising nearly 18% of the total population. As both a product of immigration and of births within the U.S., the Hispanic community contributes to an increasingly diverse population, setting the nation apart with its rich traditions, language, and history. Hispanics trace their roots to countries in Latin America or to Spain, and they may or may not be native Spanish speakers. It is essential to note that Hispanic or Latino identity transcends geographical origins and focuses on cultural affiliation. Despite the slowed growth over the past decade, the Hispanic population is still a significant contributor to overall population growth, accounting for 52% of all U.S. population growth between 2010 and 2020.
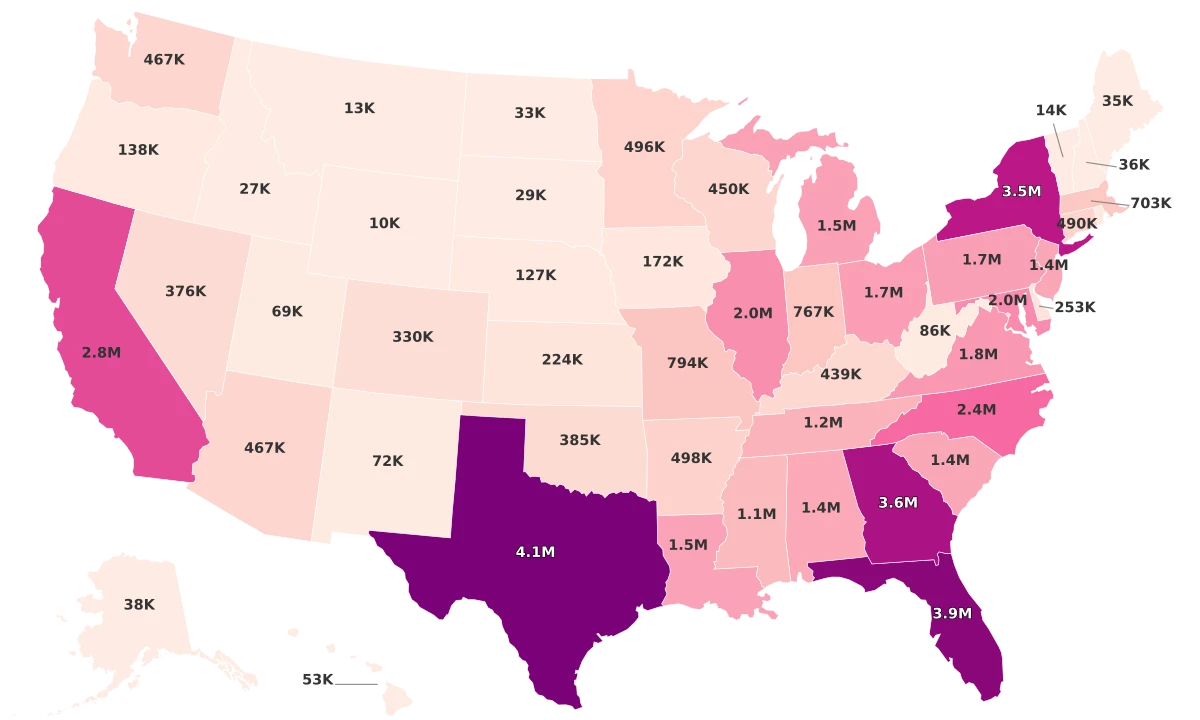
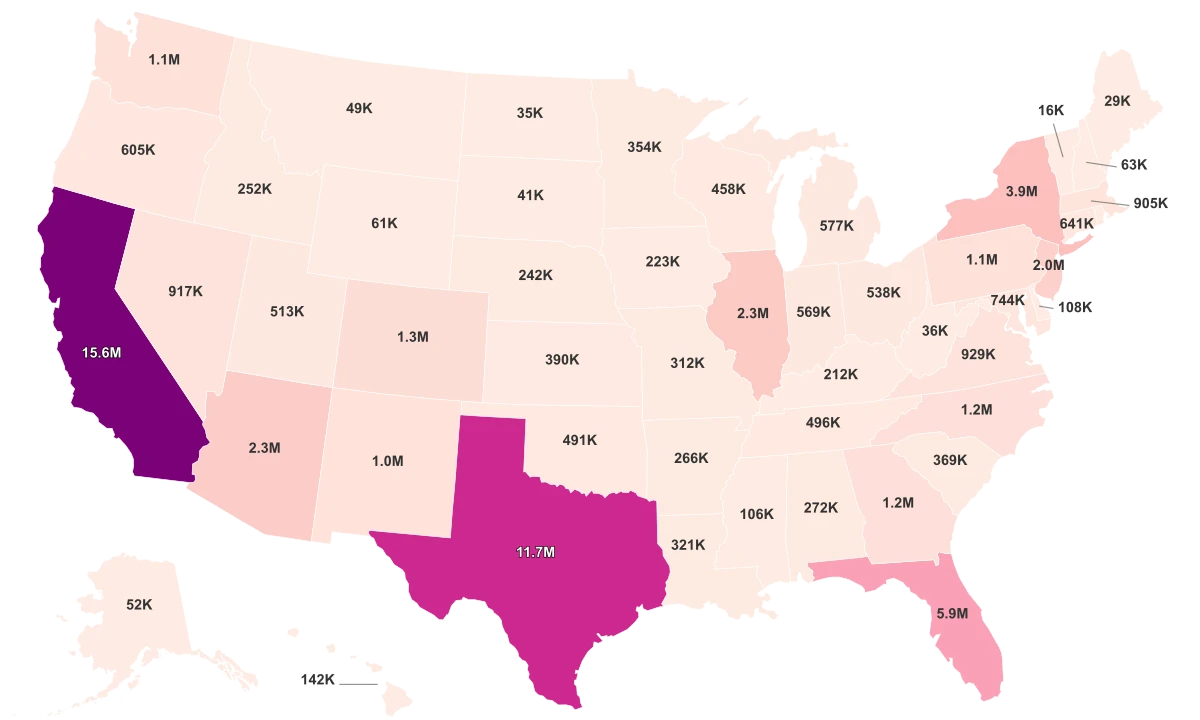
- With a whopping Hispanic population of 15.38 million, California sits at the helm of the list. Not only does it have the largest Hispanic population, but almost 39% of California's total population is Hispanic, underscoring the state's rich tapestry of cultural diversity.
- Texas follows as the second state with the highest Hispanic count, reaching an impressive 11.29 million. This figure represents about 39% of the total Texas population.
- Florida and New York rank third and fourth, with Hispanic populations of 5.47 million and 3.72 million, respectively. However, while Hispanics represent approximately 26% of Florida's total population, they form approximately 19% of New York's population.
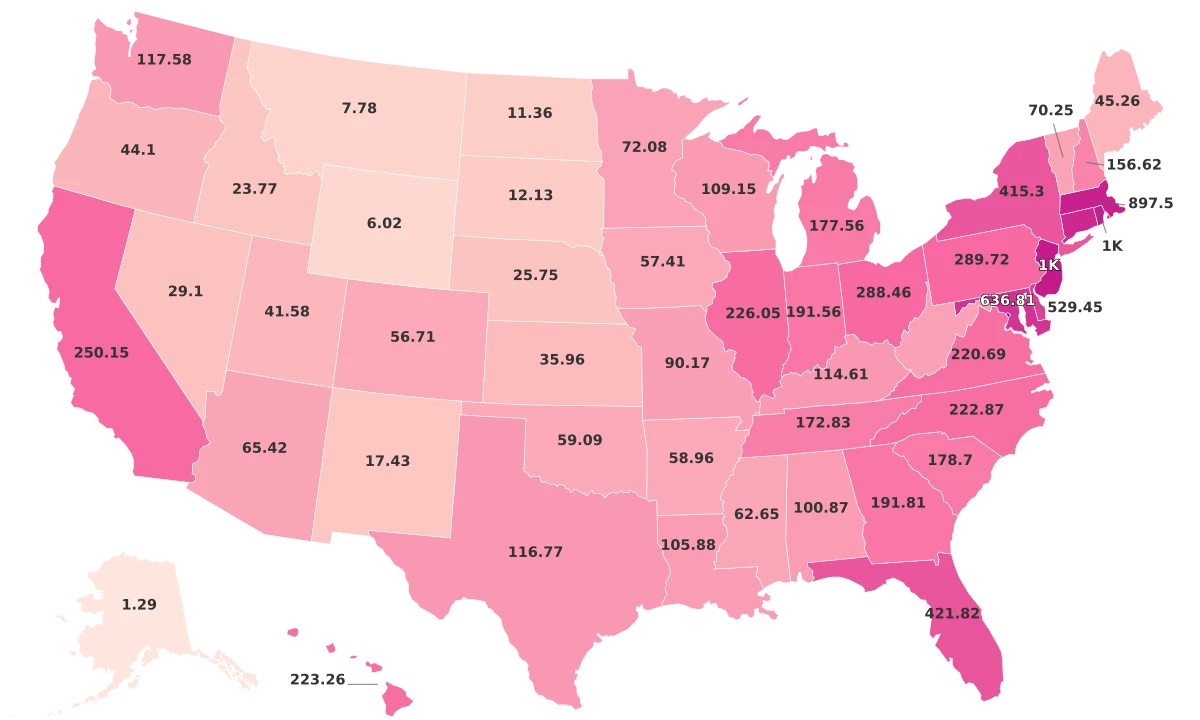
- On the other end of the spectrum, the states with the smallest Hispanic populations include West Virginia (28,679), Maine (23,143), and Vermont (12,518). Despite having smaller numbers, these communities undoubtedly contribute to the rich cultural diversity in these states.
States with the Largest Hispanic Populations
Topping the list is California, which houses a staggering 15,380,929 Hispanic residents. This population makes up nearly 39% of the state's total population, infusing it with a rich diversity that manifests in its cultural fabric. Coming in second, we have Texas, with a Hispanic community of 11,294,257. Representing roughly 39% of the state's total population, the Hispanic individuals significantly shape its socio-cultural life. In third position, we find Florida, home to 5,468,826 Hispanic citizens. This community amounts to about 26% of the state's overall population. New York ranks fourth on our list, with a Hispanic population of 3,720,707, representing approximately 19% of the state's population. Arizona and Illinois hold the fifth and sixth positions, respectively, housing 2,260,690 and 2,190,696 Hispanic individuals each. New Jersey, Colorado, New Mexico, and Georgia are next, each boasting a prominent Hispanic representation of over a million residents. States with the Largest Hispanic Populations:
- California - 15,380,929
- Texas - 11,294,257
- Florida - 5,468,826
- New York - 3,720,707
- Arizona - 2,260,690
- Illinois - 2,190,696
- New Jersey - 1,815,078
- Colorado - 1,231,126
- New Mexico - 1,031,788
- Georgia - 1,013,057