§ 03
The Pursuit of Happiness: A State-by-State Analysis
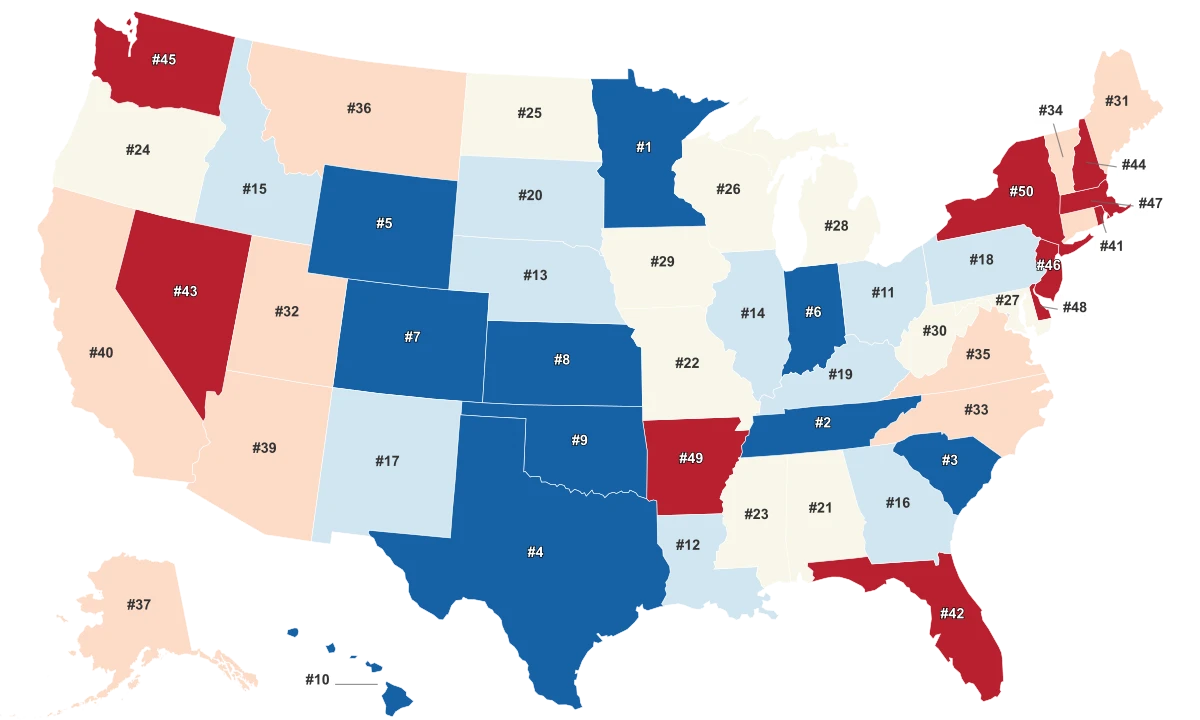
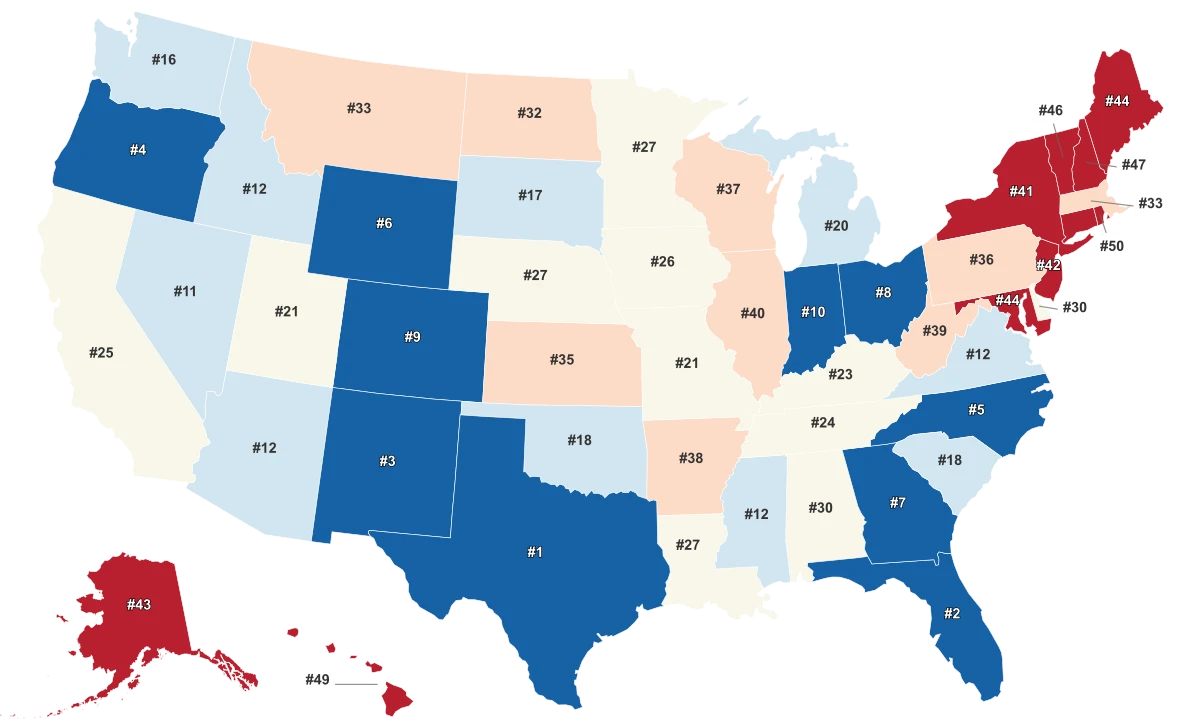
How does happiness vary across the 50 states of America? Is living in North Dakota fundamentally happier than living in Arkansas? Our perception of happiness is influenced by various internal and external factors. To understand and measure this elusive emotion, we need to consider an array of factors such as emotional & physical well-being, job security, income growth, work environment, and even the climate. To delve into this intriguing topic, we created a 'Happiness Score'. This score is a reflection of the state's performance across the three major categories: Emotional & Physical Well-Being, Work Environment, and Community & Environment.
- North Dakota tops the list, dubbed the 'Happiest State', with a score of 73.2.
- In general, states in the northern part of the country, including New Hampshire, Wyoming, and South Dakota, scored highly, indicating a higher level of happiness among their residents when compared to their counterparts in the south.
- Hawaii stands out as an exception to the trend of Northern dominance, securing a seventh position on the list, owing largely to its unique mix of natural beauty and quality of life factors.
- At the other end of the spectrum, Southern states like Arkansas, Oklahoma, and Louisiana scored the lowest, suggesting residents there face more challenges in maintaining optimal emotional & physical well-being, job satisfaction, and a favorable work and community environment.
- There's a large disparity in scores between the happiest state (North Dakota) and the least happy state (Arkansas) – a difference of around 21 points, demonstrating significant regional differences in happiness levels across America.
§ 04
Methodology
To determine the happiest states the 50 states were compared across four key categories:
- Economic Well-being
- Family and Social Connections
- Physical and Mental Well-being
- Environmental and Societal Wellness Each of these was defined via individual metrics that were representative of the category. There were a total of 30 metrics which are listed below. Each metric was graded on a 100-point scale, with a score of 100 being the max. Each metric had state scores distributed from 0 to 100. Finally, each state’s weighted average was determined across all metrics to calculate category scores. These were then summed to generate the final rank order of the states.
Economic Well-being (30%)
- **Livable Wage: Regular Weight (1.5 Points) - **This metric measures the income level that allows individuals or families to afford an adequate life.
- **Average Hourly Earnings: Regular Weight (3 Points) - **This metrics measures the average earnings per hour for individuals across all states in 2023.
- **Median Household Income: Regular Weight (3 Points) - **This metric represents the income level at which half of households earn more and half earn less.
- **Median Rent: Regular Weight (3 Points) - **This figure signifies the middle point of rent payments in a given area.
- **Poverty Rate: Regular Weight (6 Points) - **This statistic indicates the proportion of people living below the poverty line in a specific region.
- **Layoffs and Discharges: Regular Weight (1.5 Points) - **This term quantifies the number of individuals who have lost their jobs due to layoffs or discharges.
- **Job Openings: Regular Weight (1.5 Points) - **This metric represents the number of available positions for employment.
- **Income Inequality: Regular Weight (3 Points) - **This concept measures the unequal distribution of income among a population.
- **Debt-to-Income Ratio: Regular Weight (6 Points) - **This ratio reflects the relationship between an individual's debt and their income.
- **Percent of Households Receiving Food Stamps: Regular Weight (1.5 Points) - **This metric gauges the percentage of households relying on food stamps for nutritional support.
- **Foreclosure Rate: Regular Weight (2.7 Points) - **This term indicates the proportion of homes in a given area undergoing foreclosure.
Family and Social Connections (20%)
- **Divorce Rates: Regular Weight (1.2 Points) - **Divorce rates quantify the percentage of marriages that end in divorce.
- **Domestic Violence Rates: Regular Weight (4.7 Points) - **This metric measures the incidence of domestic violence within a community.
- **Child Access to Care: Regular Weight (2.4 Points) - **This term assesses the ease with which children can access essential healthcare services.
- **Average Commute Time: Regular Weight (1.2 Points) - **This figure represents the average time individuals spend commuting to and from work.
- **Public School Rankings: Regular Weight (2.4 Points) - **Public school rankings evaluate the performance and quality of education in primary and secondary schools.
- **Child Care Costs: Regular Weight (2.4 Points) - **Child care costs quantify the financial burden associated with childcare services.
- **Social Isolation Rates: Regular Weight (2.4 Points) - **This metric gauges the prevalence of social isolation within a community.
- **Households with Single Mothers: Regular Weight (2.4 Points) - **This term represents the proportion of households led by single mothers.
Physical and Mental Well-being (30%)
- **Depression Rates: Regular Weight (8.6 Points) - **Depression rates measure the prevalence of clinical depression within each state in the US.
- **Life Expectancy Rate: Regular Weight (4.3 Points) - **Life expectancy rate indicates the average number of years a person can expect to live.
- **Adult Access to Care: Regular Weight (4.3 Points) - **This term assesses the ease with which adults can access essential healthcare services.
- **Exercise Rates: Regular Weight (4.3 Points) - **Exercise rates measure the percentage of the population engaging in regular physical activity.
- **Suicide Rates: Regular Weight (4.3 Points) - **Suicide rates quantify the number of self-inflicted deaths within each state in 2021.
- **Avoided Care due to Cost: Regular Weight (4.3 Points) - **This metric indicates the percentage of individuals who forego necessary medical care due to financial constraints.
Environmental and Societal Wellness (20%)
- **Violent Crime Rates: Regular Weight (6.7 Points) - **Violent crime rates measure the frequency of serious offenses involving force or threat in 2022.
- **Non-violent Crime Rates: Regular Weight (3.3 Points) - **Non-violent crime rates quantify the occurrence of offenses that do not involve force or threat in 2022.
- **Air Quality Index: Regular Weight (3.3 Points) - **Air quality assesses the cleanliness of the air in a given area.
- **Police Officers Rate: Regular Weight (3.3 Points) - **This metric represents the number of police officers per capita in 2022.
- **Volunteer Rate: Regular Weight (3.3 Points) - **Volunteer rate measures the percentage of the population engaged in community service or charitable activities.