

















































Key Takeaways
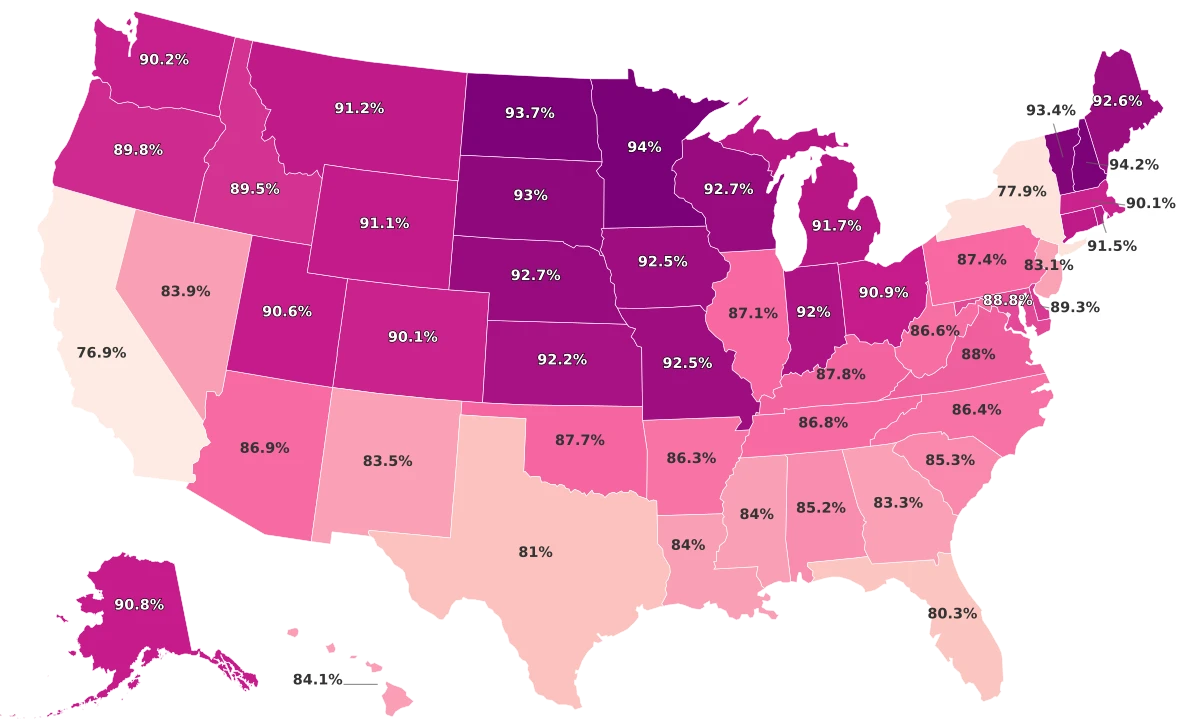
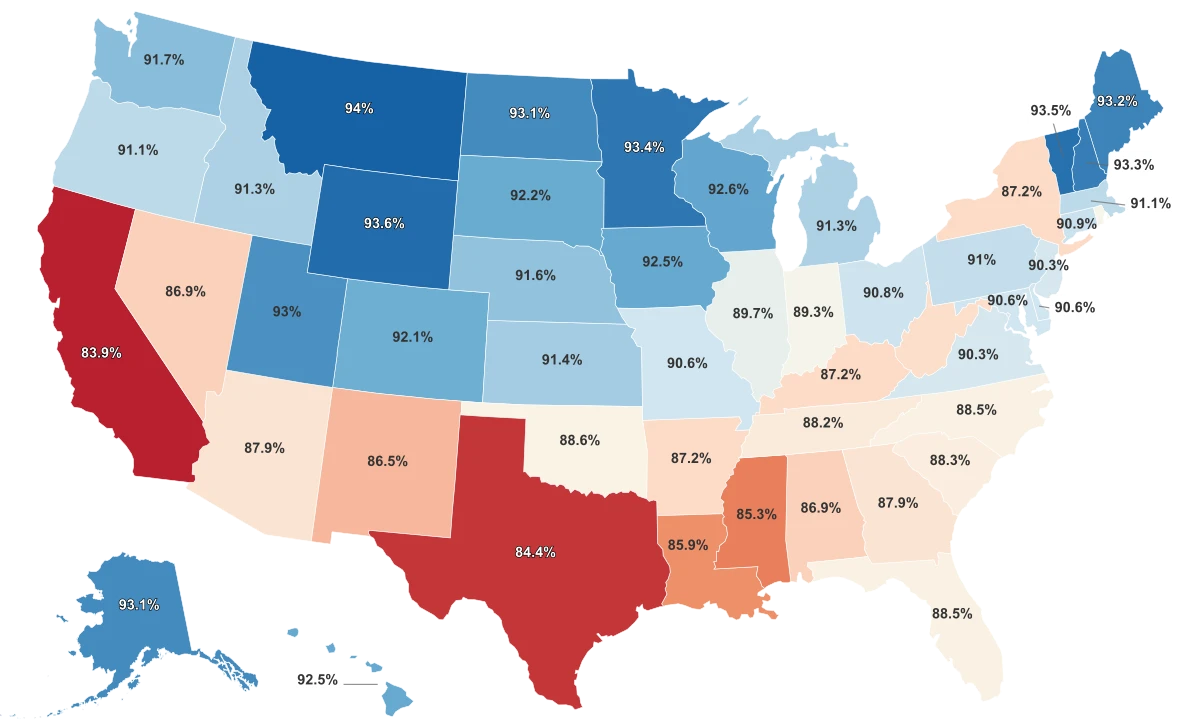
- Montana leads the country, where 94.0% of adults hold a high school diploma or its equivalent.
- California sits last at 83.9%, with Texas just ahead at 84.4%.
- The entire country fits inside about a 10-point band, so completion is more even than almost any other state ranking.
- The two states at the bottom are the two largest immigrant-receiving states, not the states with the worst schools.
Almost Every State Hands Out Diplomas at the Same Rate
This is not the graduation rate most people picture. The figures come from the U.S. Census Bureau's American Community Survey, and they count the share of adults age 25 and over who have finished high school or earned an equivalent like a GED. That is educational attainment across everyone already living in a state, not the four-year rate of this year's seniors. A higher number simply means more grown-ups in that state hold a diploma.
By that measure, Montana comes out on top, where 94.0% of adults have completed high school. California sits at the bottom at 83.9%, with Texas a half-point ahead. The data is the 2018-2022 ACS 5-year estimate, the most recent five-year file behind this dataset.
What stands out is how little separates the states. The gap from first to last is roughly 10 points, and most of the country bunches together in the high 80s and low 90s. On a map shaded by completion, almost every state lands in the same color band. This is not a ranking with a dramatic spread. It is a ranking where nearly everyone clears the bar, and the interesting question is who does not.
California and Texas Are the Outliers the Map Hides
Two states genuinely break from the pack, and they happen to be the two largest. California falls more than 6 points below the national average, and Texas more than 5. No other state sits as far from the middle as these two. They are the real story this data tells, and the reason has little to do with their classrooms.
California and Texas are the two biggest immigrant-receiving states in the country. According to the Migration Policy Institute, immigrants make up 28% of California's population, the highest share of any state, and California and Texas hold the two largest immigrant populations nationally. Nearly half of all immigrants nationwide report speaking English less than "very well." Many of these adults finished secondary school in another country, and a Census tally of who holds a U.S.-style diploma does not capture that schooling.
That is what pulls the attainment figure down. It reflects who lives in a state, not how well its schools perform. The proof is in the number people usually mean when they say "graduation rate." On the four-year cohort rate tracked by the National Center for Education Statistics, which follows a class of ninth-graders to see how many finish in four years, California graduated 87% and Texas 90% in 2021-22. Both met or beat the national average of 87%. The states at the bottom of the attainment table are not at the bottom of the schools' graduation table.
The regional pattern that the map seems to suggest is real but modest. Southern states average 87.9% completion, while the Midwest averages 91.5%. That is a gap of under 4 points, not the chasm the color shading implies. The states at the very top, Montana, Wyoming, Vermont, Minnesota, are rural and demographically homogeneous, with few foreign-born residents, so almost their entire adult population was schooled domestically and counted as a completer.
More Money, Same Diplomas
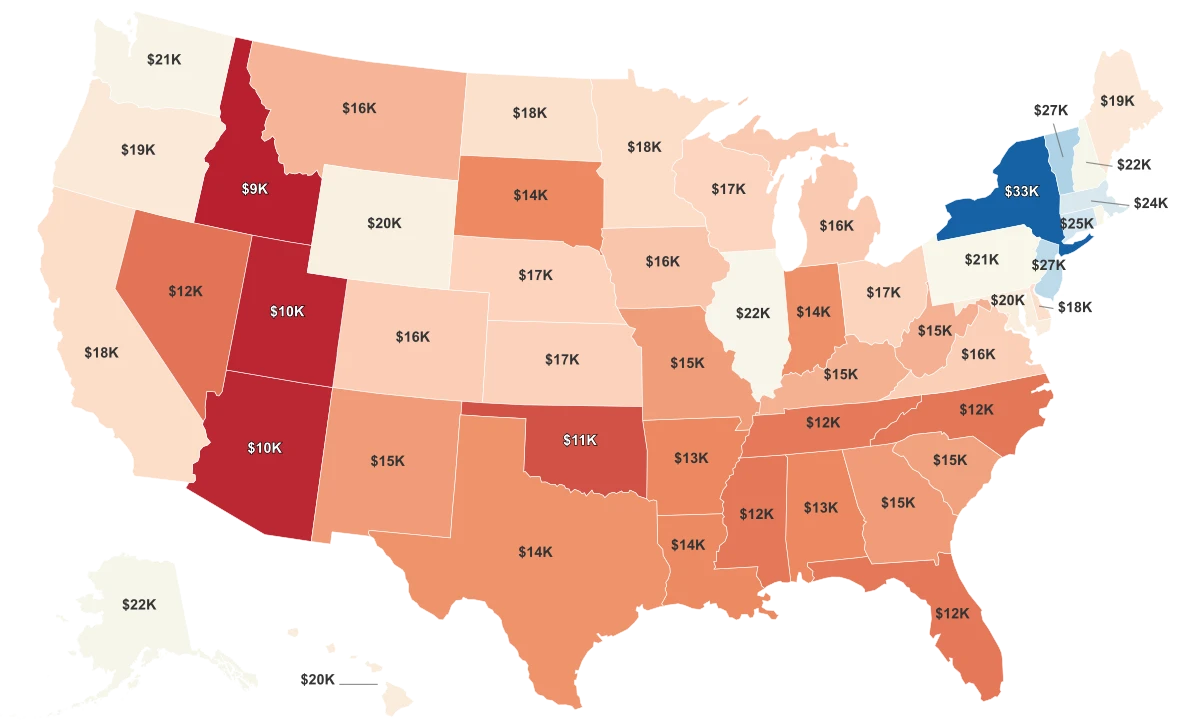
It would be reasonable to assume that the states writing the biggest checks per student also get the most students to a diploma. The data barely supports it. Across all 50 states, reported per-pupil spending explains only about 9% of the variation in completion. The link is so faint that it nearly disappears under statistical scrutiny.
The spending leaders make the point. Per the NCES, total per-pupil expenditures were highest in the District of Columbia and New York, at $37,835 and $32,184. Both are well-funded systems by any standard, yet neither tops the completion ranking, and several of the leanest-spending states finish near the top of it. The states that get the most adults to a diploma are not the ones that spend the most to do it.
Spending More Per Student Does Not Buy More Diplomas
Across all 50 states, reported per-pupil K-12 spending barely tracks high school completion.
One caveat belongs here. The per-pupil dollar figures in this dataset arrive without a listed source, so they are best read as reported spending for relative comparison rather than precise accounting. Even granting that, the shape of the relationship holds: the cloud of states scatters almost flat, and the money a state spends tells you very little about how many of its residents hold a diploma.