§ 03
Introduction
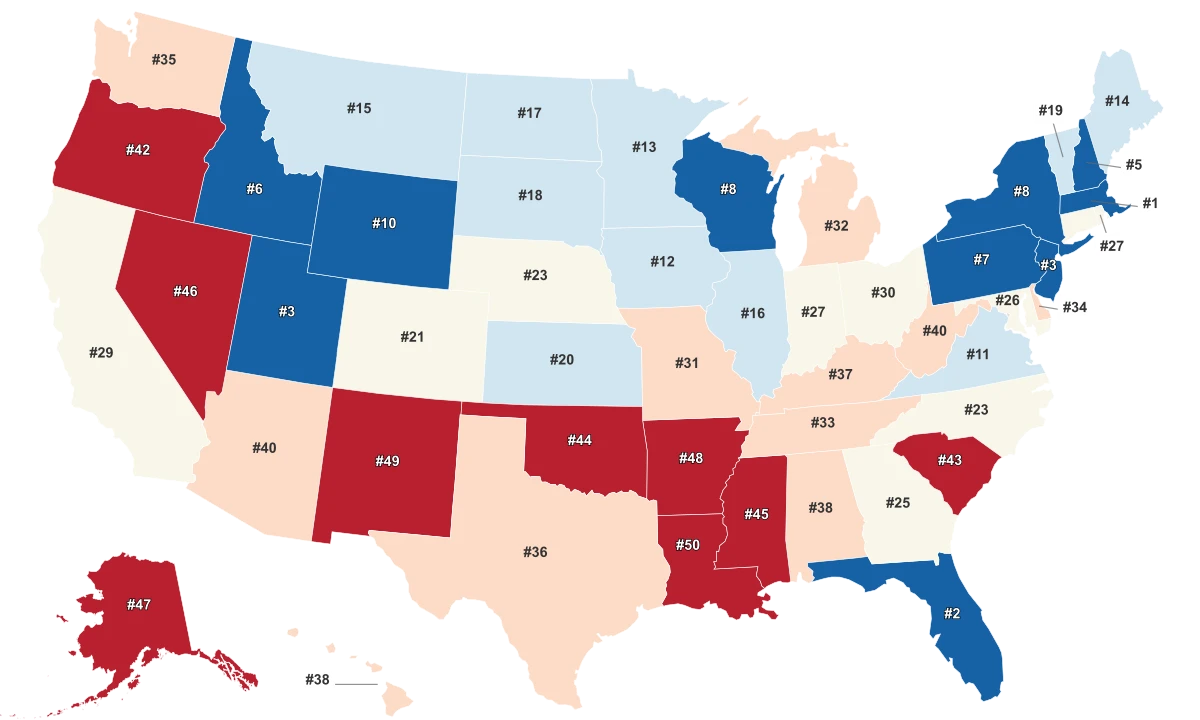
While America is a frontrunner in healthcare spending, the complex mosaic of health outcomes across the 50 states paints an intriguing picture. Beginning with a detailed analysis of the United States' health standards, this article sets forth to rank states based on a comprehensive 'Health Index Score'. This score is a quantifiable representation of health in various states on the back of key determinants such as disease prevalence, quality of healthcare, lifestyle factors, and access to health services amongst others.
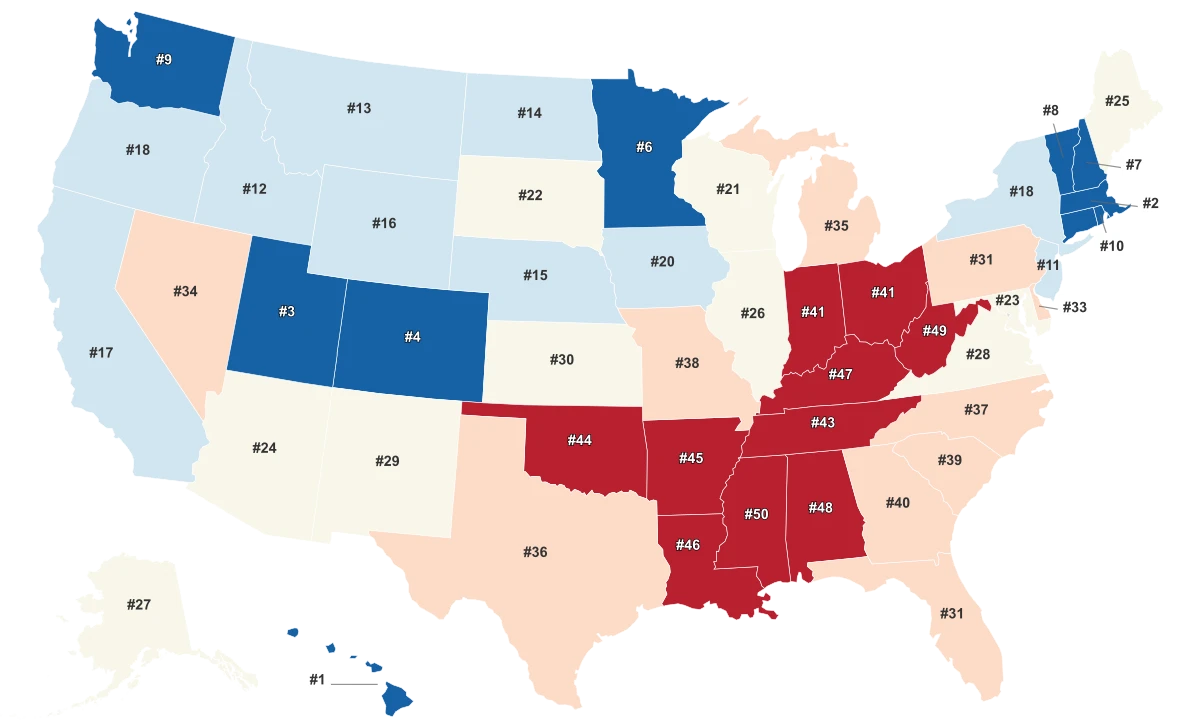
- The healthiest states are predominantly located in the Northeast, and West of the United States.
- The Southern states showed a concerning trend with poorer health outcomes when compared to the rest of the United States.
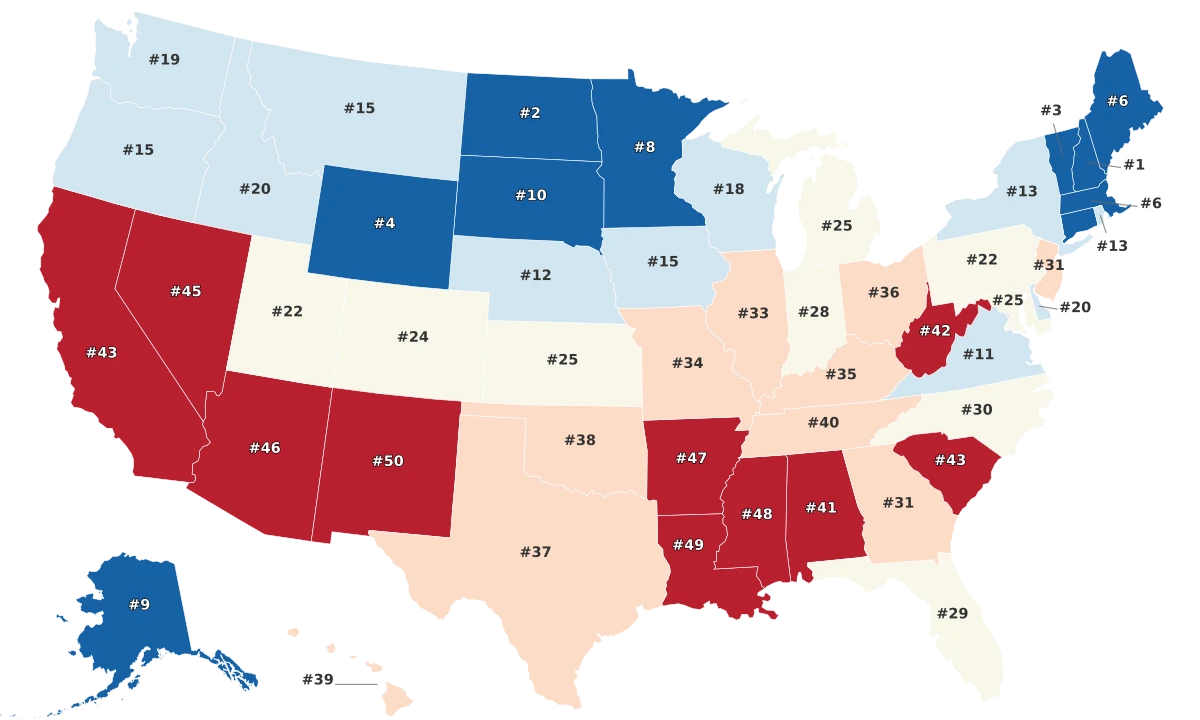
- States with higher obesity rates typically had lower health index scores, magnifying the impact of obesity on overall health. West Virginia, Mississippi, Alabama, and Louisiana with high obesity rates also had lower health index scores.
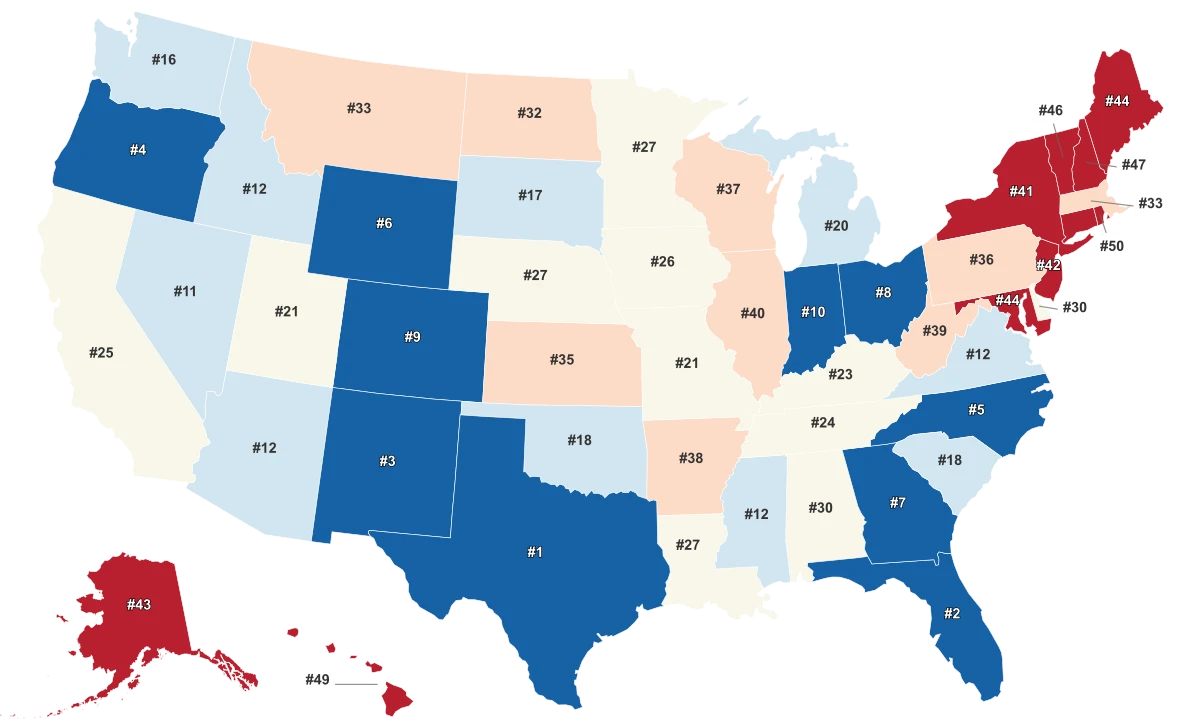
- Despite being a financial powerhouse, states like New York (71.8) and California (72.1) fell outside of the top ten states for health indexes.
- States with a greater emphasis on outdoor activities such as Colorado (77.7) and Utah (77.9) boasted high health index scores. This suggests the potential positive influence of active lifestyles and healthier behaviors on health outcomes.
§ 04
Methodology
To determine the healthiest states the 50 states were compared across five key categories:
- Mortality Rates
- Disease Prevalence
- Citizen Health
- Healthcare Quality
- Physical Environment Each of these was defined via individual metrics that were representation of the category. There was a total of 53 metrics which are listed below. Each metric was graded on a 100-point scale, with a score of 100 being the max. Each metric had states scores distributed from 0 to 100. Finally, each state’s weighted average was determined across all metrics to calculate category scores. These were then summed to generate the final rank order of the states.
Mortality Rates (30%)
- Alzheimer's Mortality Rate: Regular Weight (1.9)
- Cancer Mortality Rate: Regular Weight (3.9)
- Chronic Lower Respiratory Disease Mortality Rate: Regular Weight (1.9)
- Diabetes Mortality Rate: Regular Weight (1.9)
- Flu and Pneumonia Mortality Rate: Regular Weight (1.9)
- Heart Disease Mortality Rate: Regular Weight (3.9)
- Hypertension Mortality Rate: Regular Weight (1.9)
- Infant Mortality rate: Regular Weight (1.9)
- Kidney Mortality Rate: Regular Weight (1.9)
- Liver Disease Mortality Rate: Regular Weight (1.9)
- Maternal Mortality Rate: Half Weight (1.9)
- Premature Death Rate: Regular Weight (1.9)
- Stroke Mortality Rate: Regular Weight (1.9)
Disease Prevalence (25%)
- % Adults with Hypertension: Regular Weight (2.3)
- Cancer Rate: Regular Weight (2.3)
- Chlamydia Rate: Half Weight (1.1)
- Coronary Heart Disease Rate: Regular Weight (2.3)
- Depression Rate: Regular Weight (2.3)
- Diabetes Rate: Regular Weight (2.3)
- Drug Death Rate: Regular Weight (2.3)
- Drug Dependence Rate: Regular Weight (2.3)
- Excessive Drinking Rate: Regular Weight (2.3)
- High Cholesterol Rate: Regular Weight (2.3)
- HIV Diagnoses per 100k: Regular Weight (1.1)
- Opioid Misuse Rate: Regular Weight (2.3)
Citizen Health (25%)
- Childhood Obesity Rate: Regular Weight (1.9)
- Fruit Consumption Rate: Regular Weight (1.9)
- Exercise Rate: Regular Weight (1.9)
- Lack of Sleep Rate: Regular Weight (1.9)
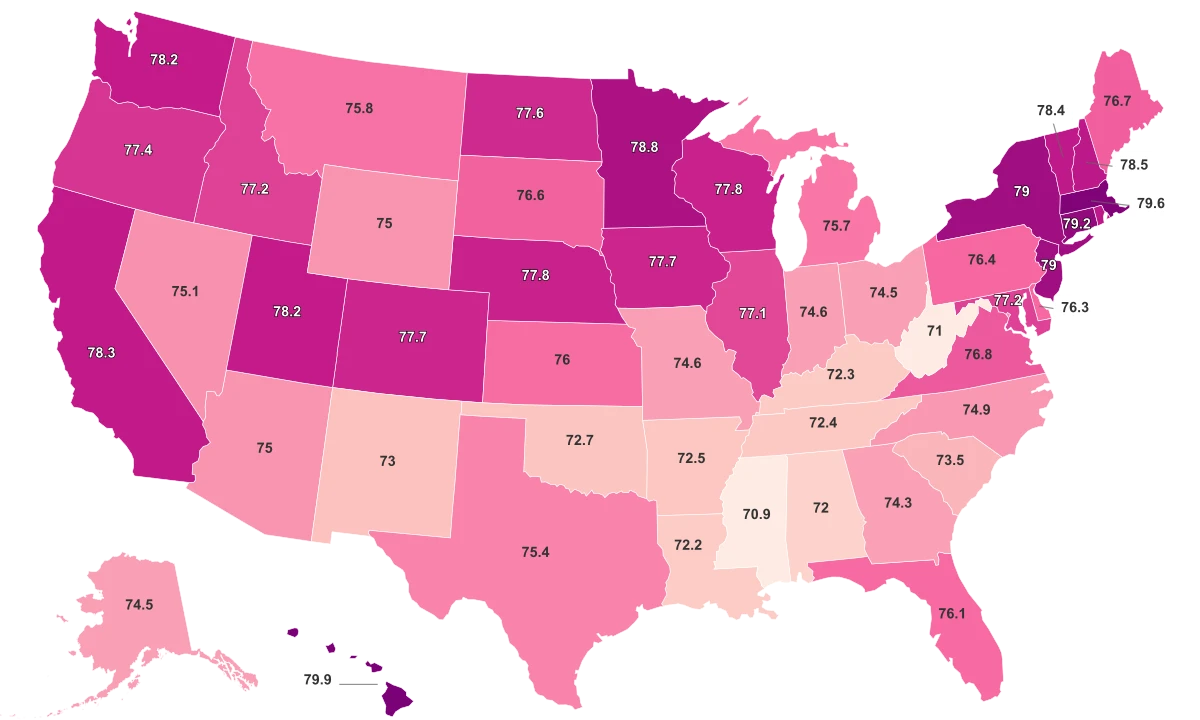
- Life Expectancy: Regular Weight (3.8)
- Obesity Rate 2021: Regular Weight (3.8)
- Physically Inactive Rate: Regular Weight (1.9)
- Preventable Hospitalizations: Regular Weight (1.9)
- Smoking Rate: Regular Weight (1.9)
- Social Isolation Rate: Regular Weight (1.9)
- Suicide Rate per 100k people: Regular Weight (1.9)
- Teen HPV Vaccination Rate: Regular Weight (1.9)
- Vegetable Consumption Rate: Regular Weight (1.9)
Healthcare Quality (10%)
- Avoided Care Due to Cost: Double Weight (1.9)
- Childhood Immunization Rate: Regular Weight (1)
- Dedicated Health Care Provider Rate: Regular Weight (1)
- Dental Visit in the Past Year: Regular Weight (1)
- Rate of Dental Care Providers: Half Weight (0.5)
- Rate of Mental Health Providers: Half Weight (0.5)
- Rate of Primary Care Providers: Half Weight (0.5)
- Uninsured Rate: Regular Weight (1)
Physical Environment (10%)
- Air Quality Index: Regular Weight (1.4)
- Drinking Water Violations: Regular Weight (1.4)
- Housing Lead Risk: Regular Weight (1.4)
- Severe Housing Problems: Regular Weight (1.4)
- Smoke Free Laws: Regular Weight (1.4)
- Toxic Chemical Risk: Regular Weight (1.4)
- Water Fluoridation Rate: Regular Weight (1.4)