More Americans Are Homeless Than at Any Point on Record
The federal government counts homeless people once a year, on a single night in January. In January 2024, volunteers and outreach workers across roughly 385 local agencies fanned out to shelters, streets, and encampments and counted 771,480 people without a place to live. That was 18% more than the year before and the highest number since HUD began tracking homelessness in 2007.
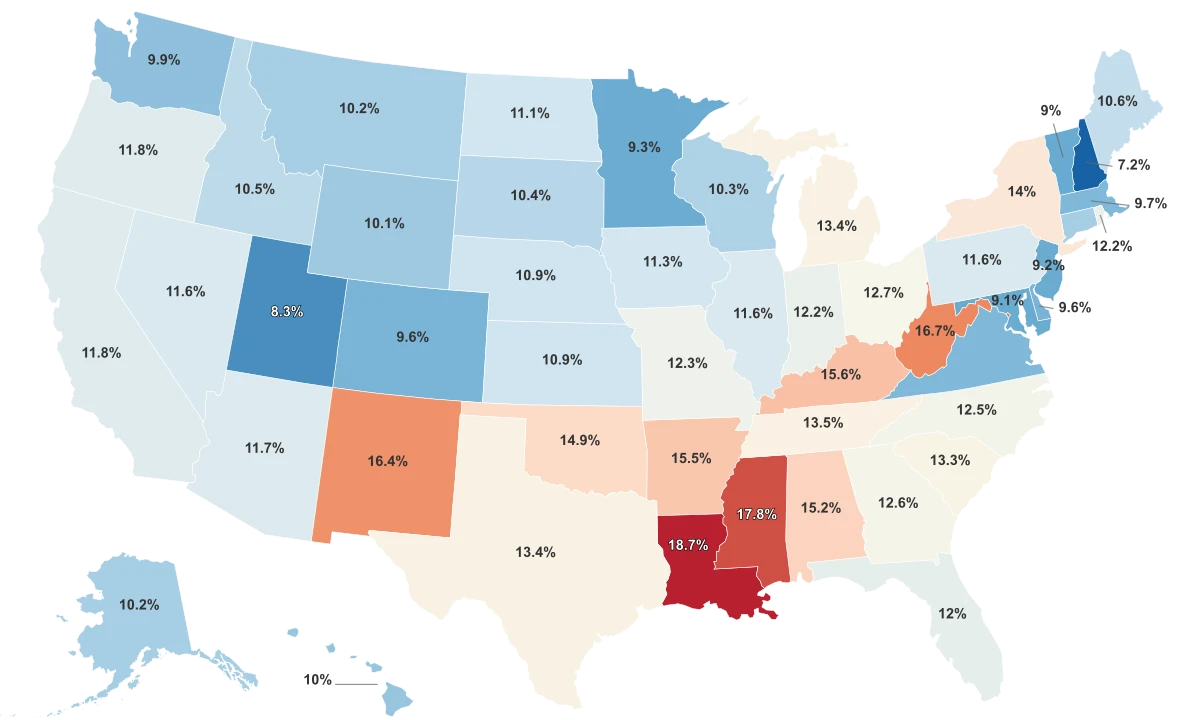
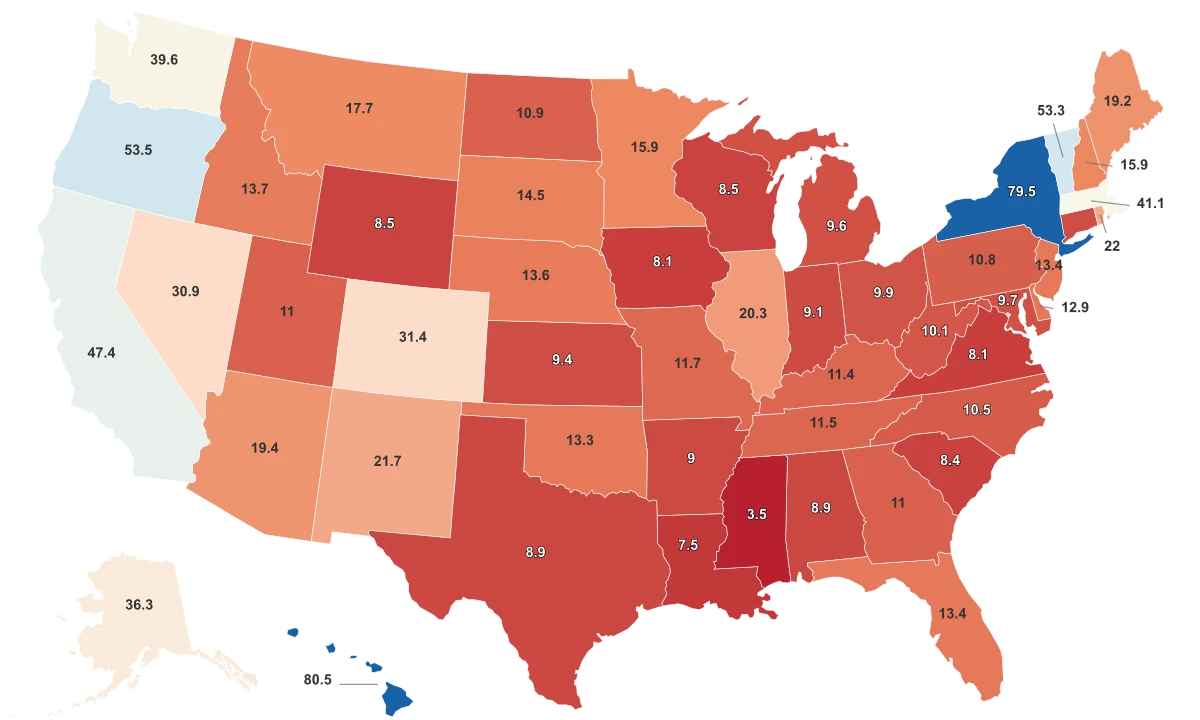
The gap across states is enormous. Hawaii leads the nation at 80.5 people per 10,000 residents. New York is just behind at 79.5. At the other end, Mississippi reports 3.5 per 10,000, a rate roughly 23 times lower than Hawaii's. The national average sits at 19.5 per 10,000, but that number is misleading: most states fall well below it. A handful of states at the top, led by Hawaii and New York, pull the average far above what the typical state actually experiences.
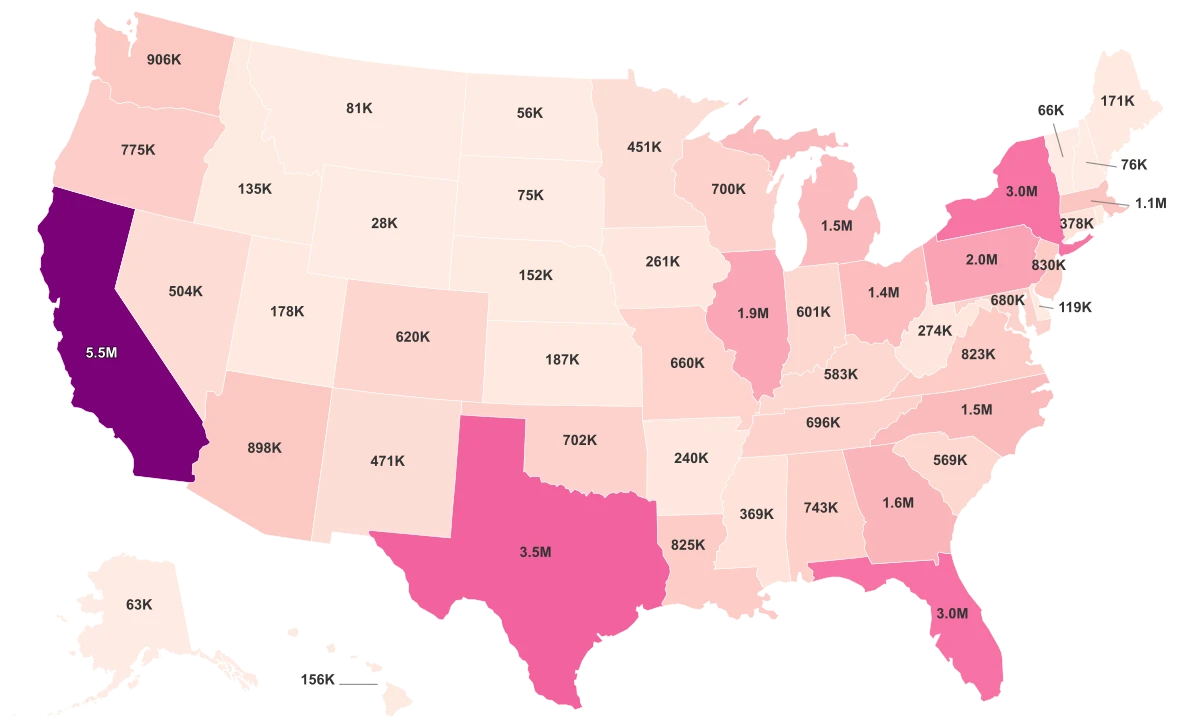
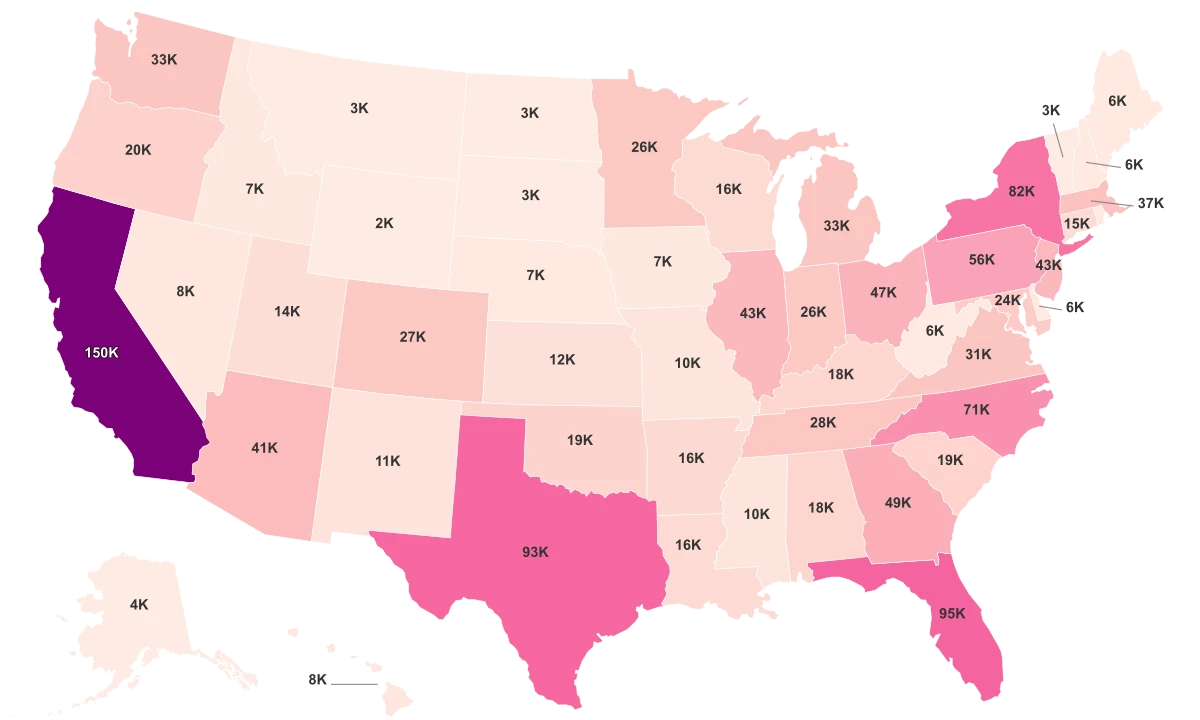
The concentration is even starker in raw numbers. Just five states, California (187,100), New York (158,000), Washington (31,600), Florida (31,400), and Massachusetts (29,400), account for 57% of every homeless person counted nationwide. The remaining 45 states and DC split the other 43%.
Homelessness Surged in Nearly Every State Between 2022 and 2024
Homeless rate per 10,000 residents changed dramatically in two years, with New York, Hawaii, and Illinois posting the largest increases.
The Poorest States Have the Fewest Homeless People
The most counterintuitive finding in the data is what does not predict homelessness. Across all 50 states, the poverty rate shows essentially no correlation with the homeless rate. The relationship is so weak that knowing a state's poverty level tells you almost nothing about how many people are sleeping on its streets or in its shelters.
Mississippi has the highest poverty rate in the country at 17.8%. It has the lowest homeless rate. Louisiana has the second-highest poverty rate at 18.7%. Its homeless rate is 7.5 per 10,000, placing it near the very bottom. Meanwhile, Hawaii has a poverty rate of just 10%, well below the national figure, and leads the country in homelessness by a wide margin.
The pattern holds at a regional level. The South averages the highest poverty rate of any region at 13.96% but the lowest average homeless rate at 9.88 per 10,000. The West averages a poverty rate of 10.93%, lower than the South, yet its average homeless rate of 31.66 per 10,000 is more than three times higher.
What does track with homelessness is rent. The National Alliance to End Homelessness identifies housing cost burden, not poverty, as the primary driver of homelessness. The data supports that finding. States where the median gross rent exceeds $1,800 a month, including California ($2,104), Hawaii ($1,942), Massachusetts ($1,848), and Washington ($1,824), dominate the top of the homeless rankings. States where rent falls below $1,000 a month, such as Mississippi ($990), West Virginia ($883), and Arkansas ($982), cluster at the bottom.
Rent Prices Track With Homelessness Rates Across All 50 States
States with the highest median rents consistently report the highest rates of homelessness per 10,000 residents, while the cheapest rental markets barely register.
What Happened in Illinois, Hawaii, and New York
The 2024 numbers did not just set a record. They reshuffled the rankings in ways that a single cause cannot explain. Three states saw their rates explode, and each for a different reason.
Illinois posted the most dramatic jump: its homeless rate nearly tripled from 7.3 to 20.3 per 10,000, a 178% increase that vaulted it from 48th to 13th in the rankings. The cause was not a housing crisis. Beginning in late 2022, more than 35,000 migrants and asylum seekers arrived in Chicago from the southern border. By the January 2024 count, over 13,600 new arrivals were living in city shelters. The long-term resident homeless population also rose by 25%, but the migrant influx was the dominant factor.
Hawaii jumped from 41.4 to 80.5 per 10,000, a 94% increase that pushed it from fourth to first in the nation. The Maui wildfires of August 2023, which destroyed the town of Lahaina and displaced thousands of residents, account for a large share of that surge. Hawaii's already severe housing shortage, driven by finite island geography and the highest median rents outside California, made recovery housing nearly impossible to find.
New York climbed from 37.4 to 79.5 per 10,000, a 113% increase that doubled its homeless population from roughly 74,000 to 158,000. New York is unique among states: a 1981 consent decree known as Callahan v. Carey requires the city to shelter anyone who asks. That mandate, combined with a wave of asylum seekers arriving in New York City, pushed the shelter system to capacity and inflated the state's count far beyond what most states would report under the same conditions.
Not every state surged. Louisiana saw its rate cut in half, falling from 15.9 to 7.5 per 10,000 and dropping 35 spots in the rankings. Maine declined from 32.1 to 19.2.
Two Out of Three Homeless Californians Sleep Outside
The national homeless count treats all homeless people equally, but the experience of homelessness varies enormously depending on where a person lives. In some states, being homeless means sleeping in a shelter bed. In others, it means sleeping under a highway overpass.
California reports an unsheltered rate of 67.3%, meaning two out of every three homeless Californians are living on streets, in vehicles, or in places not meant for habitation. Oregon (61.7%), Hawaii (62.7%), and Arizona (59.2%) show similar patterns. These are warm-climate states with high housing costs and limited shelter capacity relative to need.
The Northeast looks like a different country. New York reports an unsheltered rate of just 5.4%. Vermont is 1.6%. Maine is 3.7%. New York's right-to-shelter mandate explains its number directly: the legal obligation to house anyone who presents at a shelter means almost no one goes uncounted as unsheltered. Vermont and Maine invested heavily in emergency hotel and motel voucher programs during and after the pandemic, keeping their unsheltered rates near zero.
The regional divide is sharp. The West averages an unsheltered rate of 39.4%. The Northeast averages 9.8%. That gap means the same homeless rate in two different states can describe completely different realities: one person in a shelter bed with access to services, and another sleeping in a tent with none.
One surprise sits at the top of the unsheltered list. Mississippi, the state with the lowest overall homeless rate, reports an unsheltered rate of 63.6%. Only about 1,000 people in Mississippi were counted as homeless, but nearly two-thirds of them were living outside. With the smallest homeless population in the country, even a modest lack of shelter capacity translates to a high unsheltered percentage.
A Single Night in January
Every number in this ranking comes from the same source: HUD's Annual Homelessness Assessment Report, built on a nationwide Point-in-Time count. On a single night during the last 10 days of January, local agencies send volunteers to count every person they can find sleeping in shelters, on park benches, under bridges, and in encampments.
The count catches people in emergency shelters and transitional housing. It catches people sleeping visibly outdoors. What it misses is everyone else: families doubled up on a relative's couch, individuals staying in motels they cannot afford past the week, people cycling through hospitals or jails who have no home to return to. The Department of Education, which uses a broader definition under the McKinney-Vento Act, consistently identifies far more homeless children and youth than HUD's count captures.
Timing matters too. The count happens in January, when freezing temperatures in the Midwest and Northeast drive people indoors or into hiding. A homeless person in Chicago who spends one night with a friend to escape the cold will not appear in the data. A homeless person in Phoenix sleeping in a public park likely will. That asymmetry means warm-climate states may appear to have higher unsheltered rates partly because their unsheltered populations are easier to find in January.
None of this means the data is useless. The PIT count is the only consistent, nationwide measurement of homelessness that exists. Its year-over-year trends are meaningful even if the absolute number is almost certainly an undercount. But readers should understand that the 771,480 figure is a floor, not a ceiling.