The Best States to Call Home
Living standards vary greatly across the United States, shaped by factors such as the economy, opportunities, quality of education, healthcare, environment, lifestyle and safety. Many factors can influence an individual's perception of a state's livability, which can be subjective and contingent on personal preferences and circumstances. However, a more objective perspective can be attained by assessing various public data points. The Livability Index quantifies these facets into a numerical score out of 100, allowing for direct comparisons between states. This measure is particularly useful for those considering relocation or simply curious about how their home state compares to the rest of the nation. Key findings from the data include: - New Hampshire topped the list with the highest Livability Index score of 66.6, boosted by strong performances in safety, education, environment, and overall living conditions. - North Dakota and Vermont also scored highly, both with a Livability Index Score of 64.2 and 64.1 respectively, showcasing strengths in their own domains across education, healthcare and lifestyle. - At the other end of the spectrum, New Mexico has the lowest Livability Index Score at 50.2, indicating a need for improvements across multiple areas including crime, education, and lifestyle conditions. - States like Connecticut (63.6) and Maine (63.3) exhibited high scores due to their strong education systems, robust economies, and favorable living conditions. - Meanwhile, states like Mississippi (51) and Louisiana (50.7) have low Livability Index scores, reflecting challenges in areas like economy and access to healthcare and education.
Methodology
To determine the Best States to Live In, the 50 states were compared across 8 key categories:
- Safety and Crime
- Health and Healthcare
- Opportunity
- Economy
- Infrastructure
- Education
- Environment
- Lifestyle
Each of these was defined by individual metrics that represented the category. There were a total of 62 metrics, which are listed below. Each metric was graded on a 100-point scale, with a score of 100 being the maximum. Each metric had state scores distributed from 0 to 100.
Finally, each state’s weighted average was determined across all metrics to calculate category scores. These were then summed to generate the final rank order of the states.
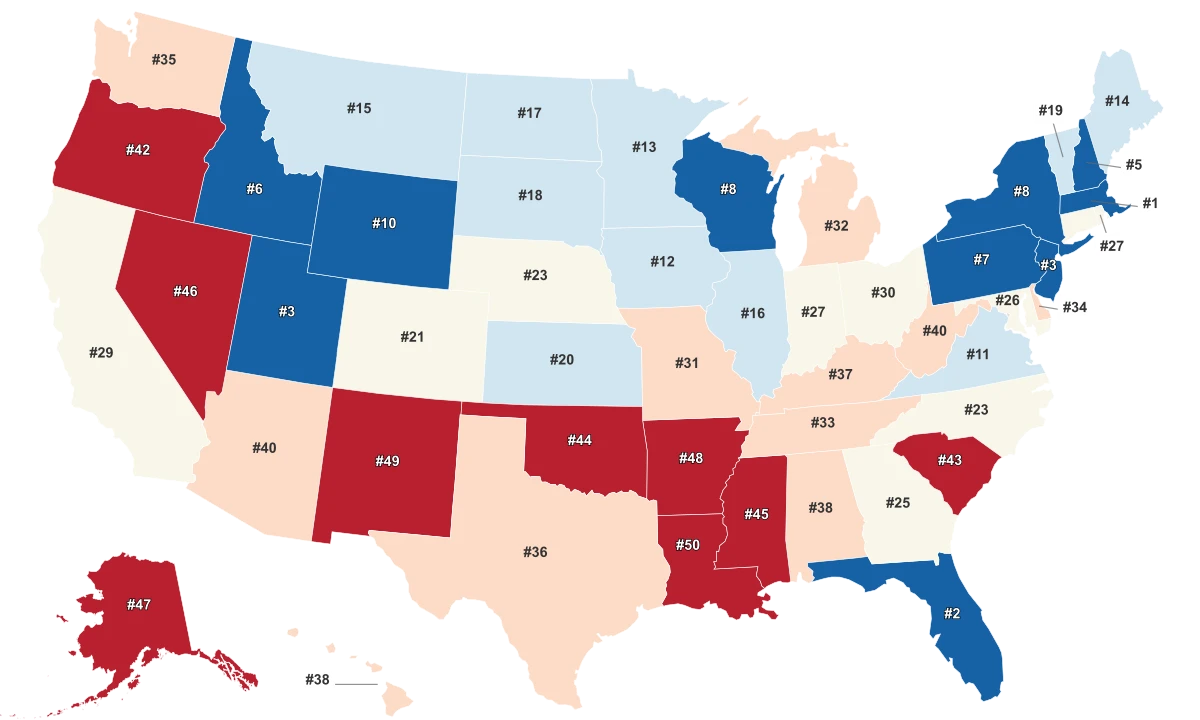
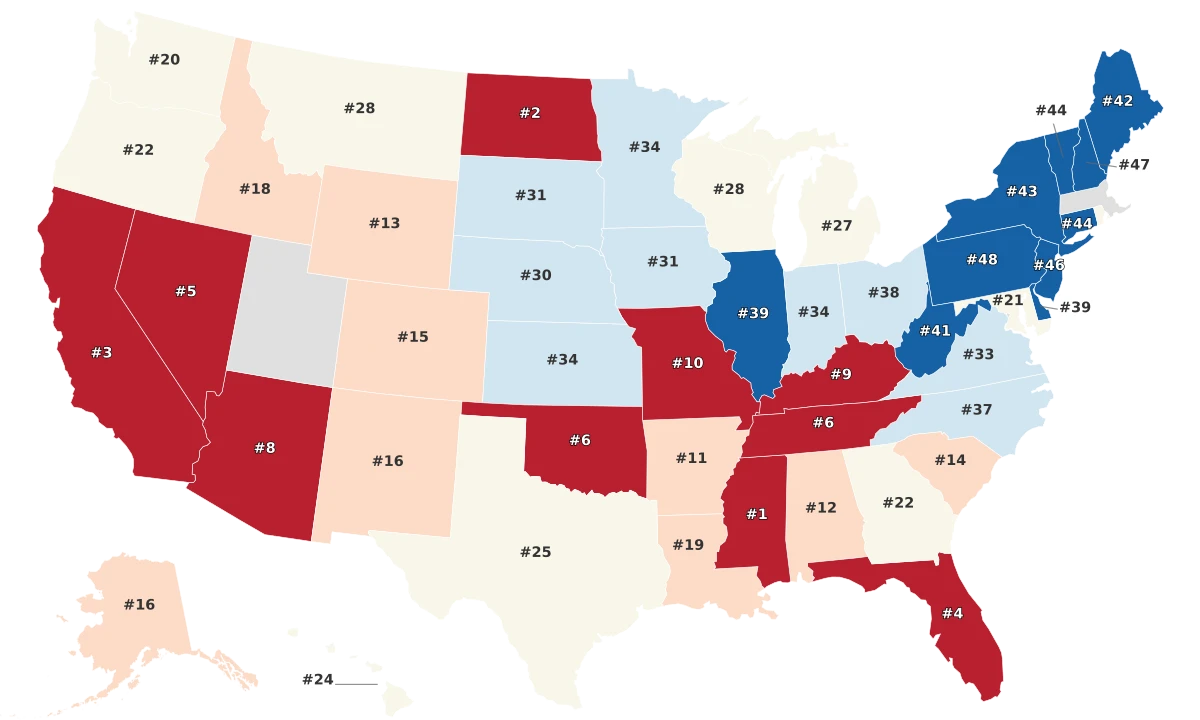
Safety and Crime (15%)
- Violent Crime Rate: Double Weight (2.7)
- Non-Violent Crime Rate: Single Weight (1.4)
- Homicide Rate: Double Weight (2.7)
- Cyber Crime Victims Rate: Single Weight (1.4)
- Police Officers Rate: Single Weight (1.4)
- Hate-Crime Incidents Rate: Double Weight (2.7)
- **Religious Freedom Protection: **Double Weight (2.7)
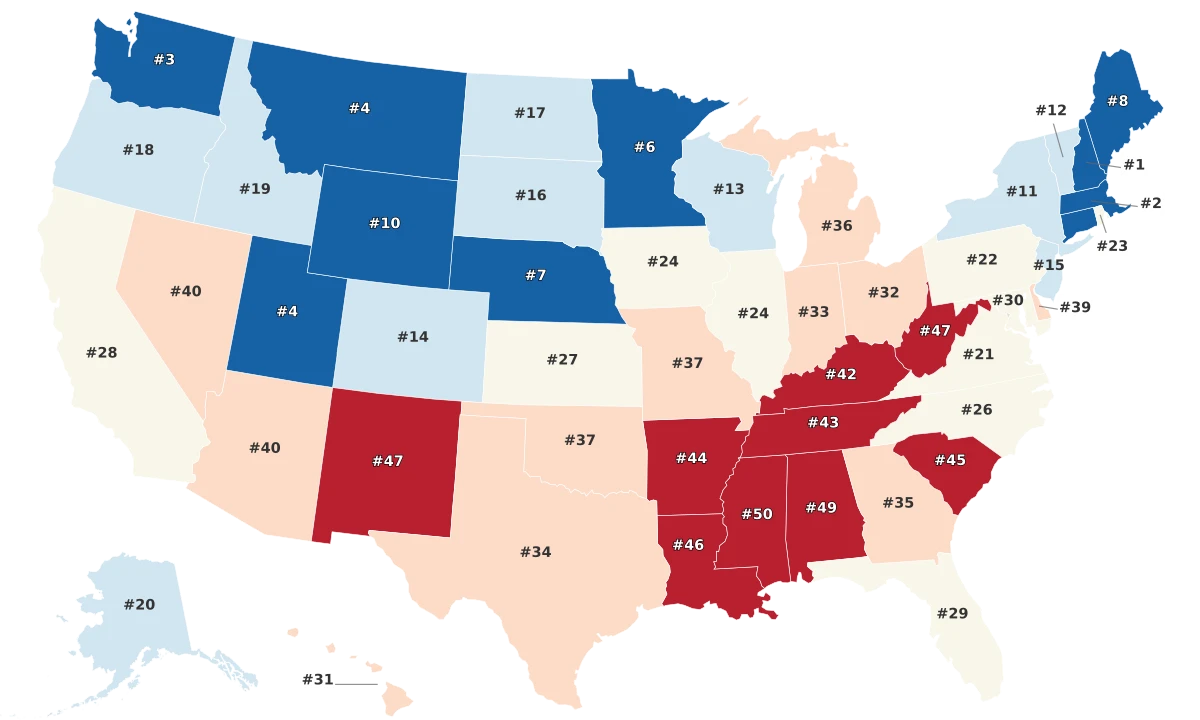
Health and Healthcare (15%)
- Life Expectancy: Single Weight (0.9)
- Rate of Dental Care Providers: Double Weight (1.9)
- Rate of Mental Health Providers: Double Weight (1.9)
- **Rate of Primary Care Providers: **Double Weight (1.9)
- **Exercise Rate: **Single Weight (0.9)
- Lack of Sleep Rate: Single Weight (0.9)
- **Drug Death Rate: **Single Weight (0.9)
- **Excessive Drinking Rate: **Single Weight (0.9)
- **STD Rate: **Single Weight (0.9)
- **Avoided Care Due to Cost: **Double Weight (1.9)
- **Adult Access to Care: **Single Weight (0.9)
- **Child Access to Care: **Single Weight (0.9)
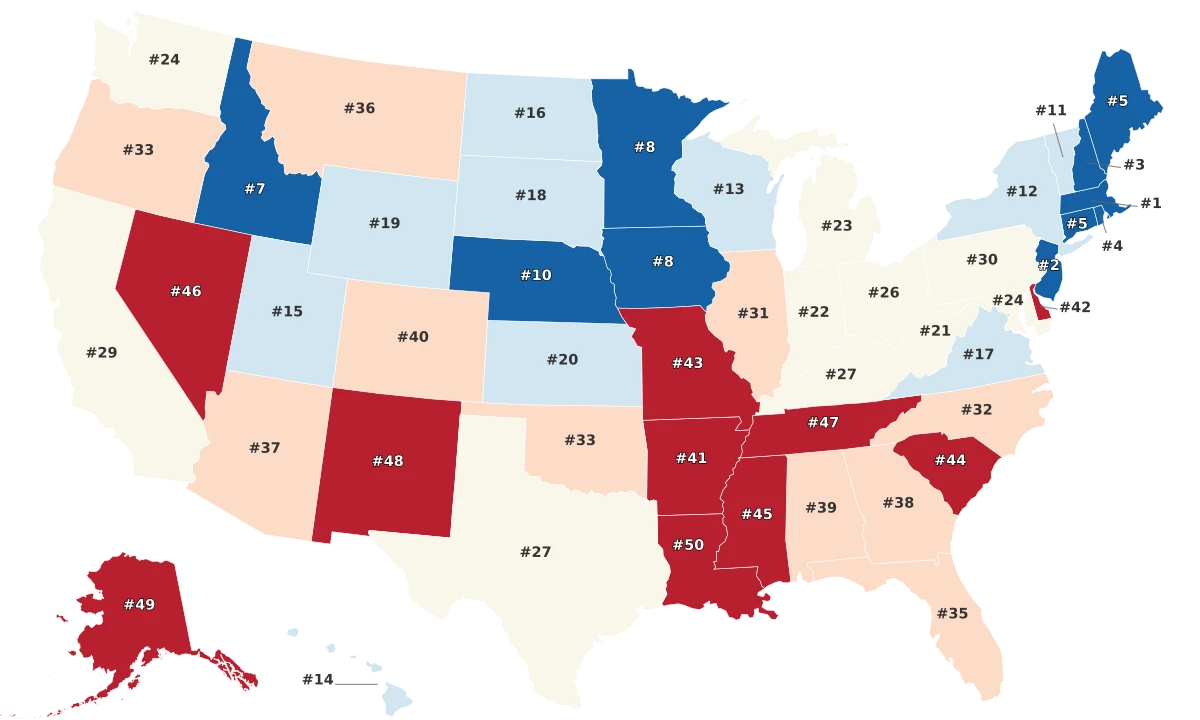
Opportunity (15%)
- **Average Annual Wage: **Single Weight (1.5)
- Per Capita Income: Single Weight (1.5)
- Average Hourly Earnings: Single Weight (1.5)
- Job Openings Rate: Single Weight (1.5)
- Unemployment Rate: Single Weight (1.5)
- **Cost of Living: **Single Weight (1.5)
- Disposable Income: Single Weight (1.5)
- Median Rent: Single Weight (1.5)
- Median Home Price: Single Weight (1.5)
- Home Ownership Rates: Single Weight (1.5)
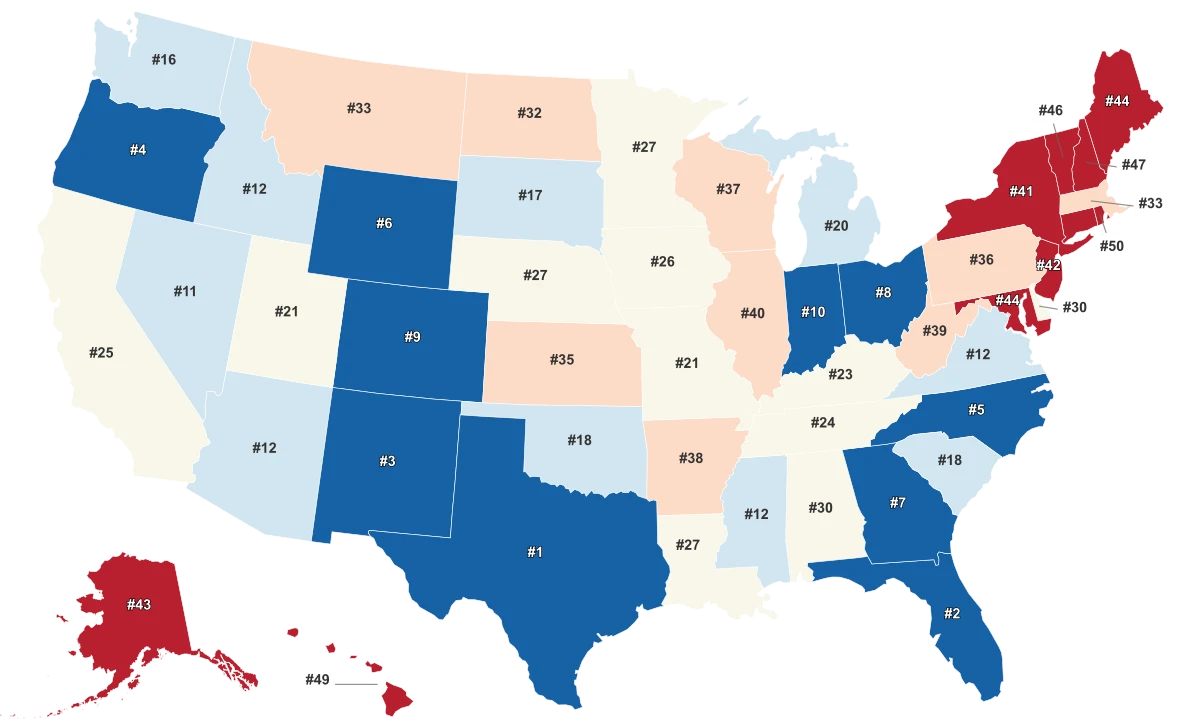
Economy (10%)
- Income Tax Rate: Regular Weight (0.7)
- State GDP Growth: Double Weight (2.9)
- Debt-to-Income Ratio Low: Double Weight (2.9)
- **Corporate Tax Rate: **Half Weight (0.7)
- Poverty Rate: Single Weight (1.4)
- **State Debt: **Single Weight (1.4)
Infrastructure (10%)
- **Internet Speed: **Single Weight (2)
- **Average Commute Time: **Single Weight (2)
- **Drinking Water Violations: **Single Weight (2)
- **Urban Pavement Roughness: **Single Weight (2)
- Share of Bridges in Poor Condition: Single Weight (2)
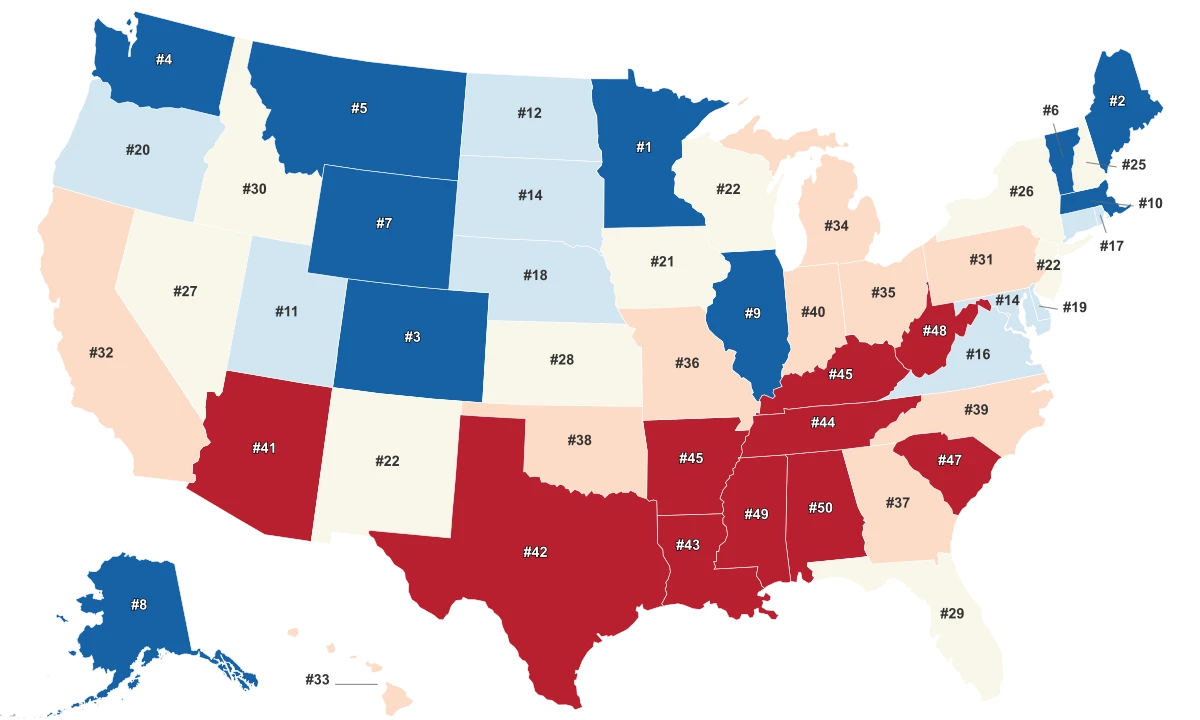
Education (10%)
- Public School Teacher Salaries: Single Weight (1.7)
- **Public School Index Score: **Single Weight (1.7)
- Per Pupil Spending: Single Weight (1.7)
- High School Completion Rate: Single Weight (1.7)
- **Average ACT Score: **Single Weight (1.7)
- Students Enrolled Per Teacher in Public Schools: Single Weight (1.7)
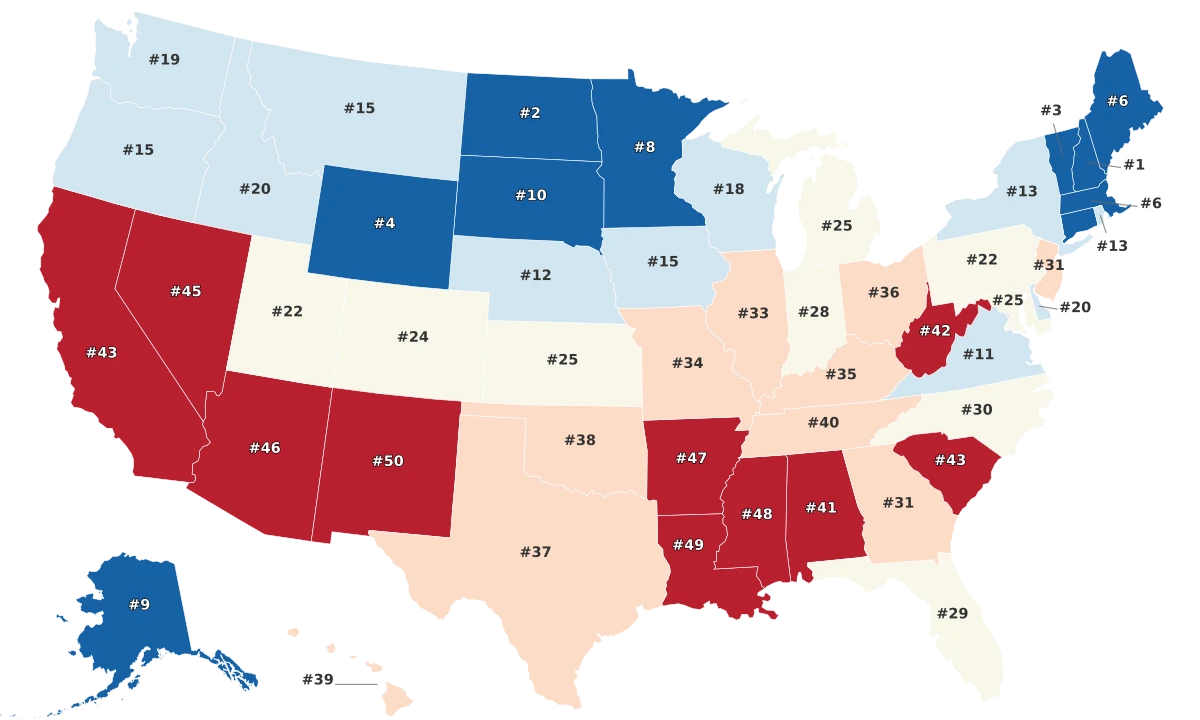
Environment (10%)
- **Toxic Chemical Risk: **Single Weight (2)
- Air Quality Index: Single Weight (2)
- **Percent of Land Forested: **Single Weight (2)
- **Trees Per Capita: **Single Weight (2)
- Portion of State Designated for Parks and Wildlife: Single Weight (2)
Lifestyle (10%)
- **Fitness and Recreational Sports Centers Per Capita: **Half Weight (1)
- Motion Picture Theaters (except Drive-Ins) Per Capita: Half Weight (1)
- **Golf Courses and Country Clubs Per Capita: **Half Weight (1)
- Drinking Places (Alcoholic Beverages) Per Capita: Half Weight (1)
- **Promoters of Performing Arts, Sports, and Similar Events without Facilities: **Half Weight (1)
- Casinos (except Casino Hotels) Per Capita: Half Weight (1)
- **Restaurants and Other Eating Places Per Capita: **Half Weight (1)
- **Zoos and Botanical Gardens Per Capita: **Half Weight (1)
- Museums Per Capita: Half Weight (1)
- **Sports Teams and Clubs Per Capita: **Half Weight (1)