Choosing the Ideal State for Couples
Deciding where to live as a couple is a complex process, encompassing a range of factors from economic prospects and living expenses to leisure activities and overall life quality. In the United States, the variance in cultural, geographical, and economic aspects from one state to another significantly influences the suitability of each region for couples, particularly those without children.
The criteria for our evaluation included aspects such as the quality of life, availability of entertainment and recreational facilities, and the richness of cultural diversity and supportive resources in each state.
Highlights from Our Findings:
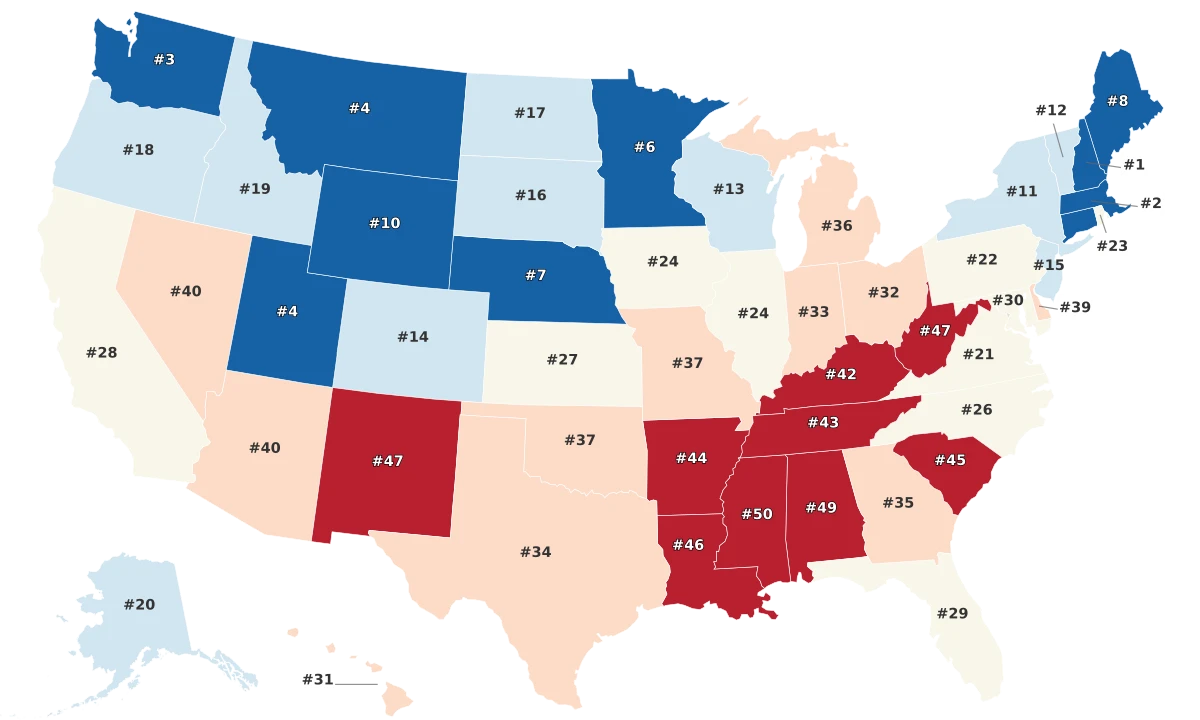
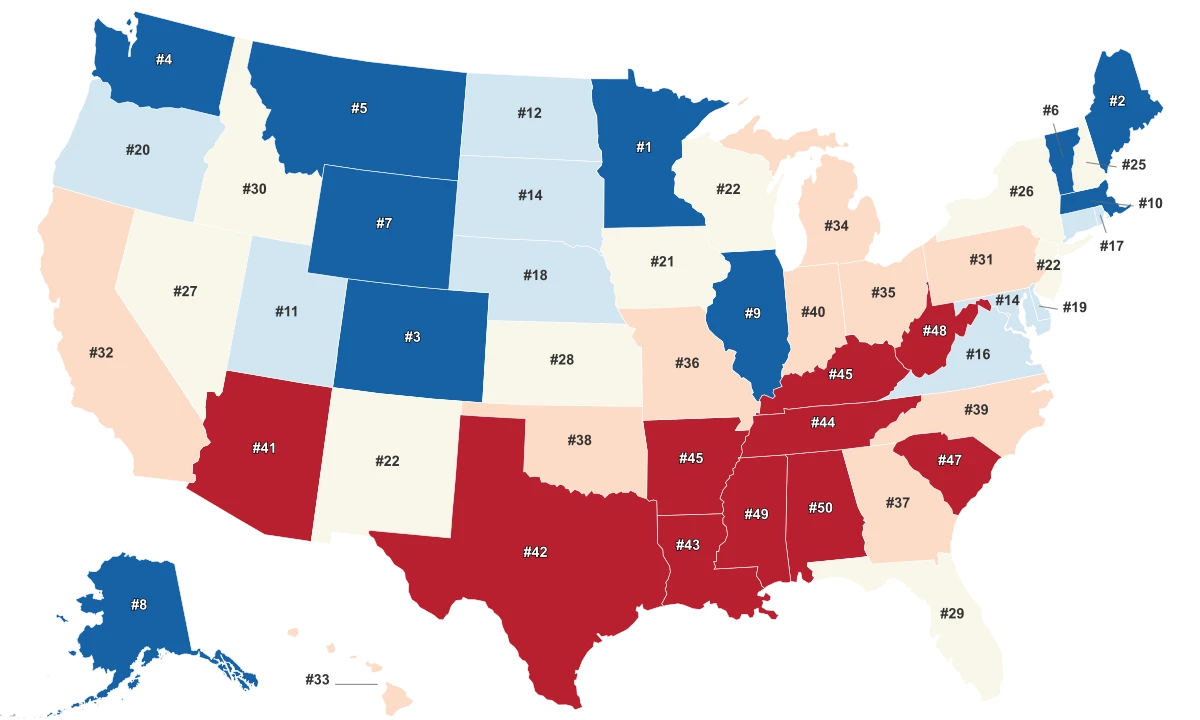
- Minnesota emerges as the leading state for couples, thanks to its balanced mix of economic stability, abundant recreational options, and a strong sense of community.
- Outdoor Lifestyle Appeal: Four out of the top five states, including Minnesota, Maine, Colorado, and Montana, are celebrated for their extensive outdoor recreation opportunities, underlining the value of nature and outdoor activities in couple satisfaction.
- Urban Attraction: Illinois, despite its urban density, ranks within the top 10, showcasing the allure of cultural diversity, urban amenities, and vibrant job markets in metropolitan settings.
- Contrasting Southern States: The lower rankings of Southern states like Louisiana, Tennessee, Arkansas, South Carolina, West Virginia, Mississippi, and Alabama point towards possible regional socio-economic challenges impacting couple contentment in these areas.
- Beyond Population and Fame: Notably absent from the top 10 are populous states like California, New York, and Florida. This observation suggests that higher population density does not necessarily equate to a higher quality of life for couples, especially those without children.
Methodology
To identify the "Best States for Couples," the study compared the 50 states across three primary categories:
- Quality of Life
- Recreation and Entertainment
- Diversity, Support, and Resources
Each category was defined by specific metrics that reflect the respective aspects. A total of 30 metrics were used, each graded on a 100-point scale, with 100 representing the optimal condition for couples. State scores ranged from 0 to 100 for each metric.
Each state's weighted average was then calculated across all metrics to determine category scores, which were summed to generate the final state rankings.
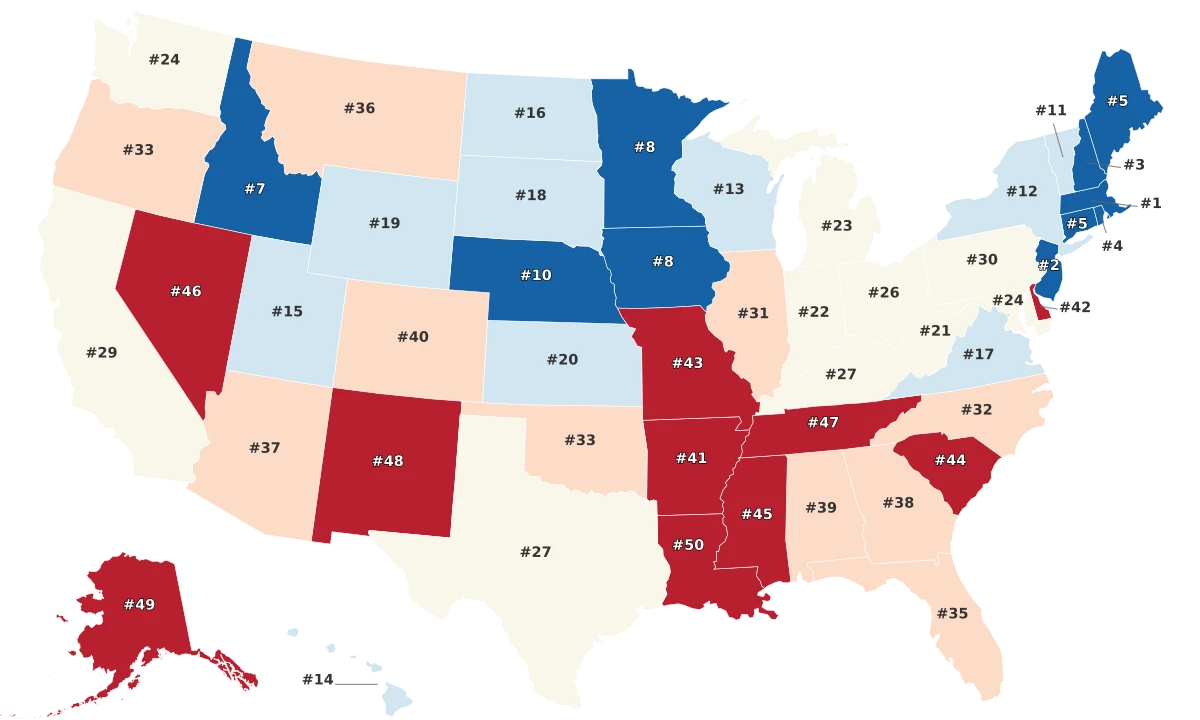
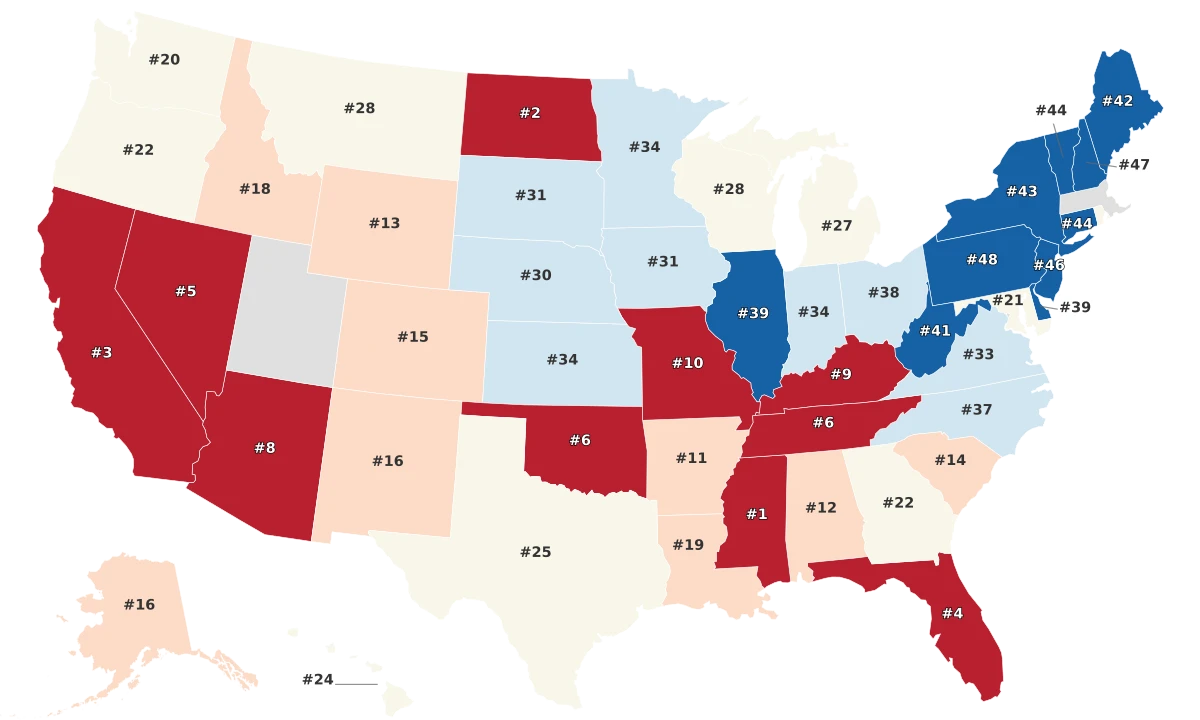
Quality of Life (40%)
- Cost of Living Index: Double Weight (4.8 Points) - Reflects the general cost of living, including housing, food, and other essentials.
- Job Growth 2022-2023: Half Weight (1.2 Points) - Assesses the rate of job growth within the state during this period.
- Home Ownership Rates (2022): Single Weight (2.4 Points) - Represents the percentage of households owning their homes.
- Housing Affordability: Double Weight (4.8 Points) - Measures the affordability of housing relative to income levels.
- State GDP Growth (2022): Half Weight (1.2 Points) - Indicates the rate of state GDP growth in 2022.
- Safety Index Score: Single Weight (2.4 Points) - Evaluates the general safety of the state.
- Reported Crime Rate (per 100k): Single Weight (2.4 Points) - Quantifies the crime rate per 100,000 residents.
- Grocery Costs Index (2023): Single Weight (2.4 Points) - Assesses the cost of groceries in the state.
- Transportation Costs Index (2023): Single Weight (2.4 Points) - Measures costs associated with transportation.
- Utility Costs Index (2023): Half Weight (1.2 Points) - Evaluates the cost of utilities like electricity and water.
- Healthcare Quality: Single Weight (2.4 Points) - Assesses the overall quality of healthcare services.
- Job Openings Rate: Single Weight (2.4 Points) - Measures the rate of job openings in the state.
- Average Taxes: Double Weight (4.8 Points) - Reflects the average tax burden in the state.
- Median Household Income: Double Weight (4.8 Points) - Represents the median income of households.
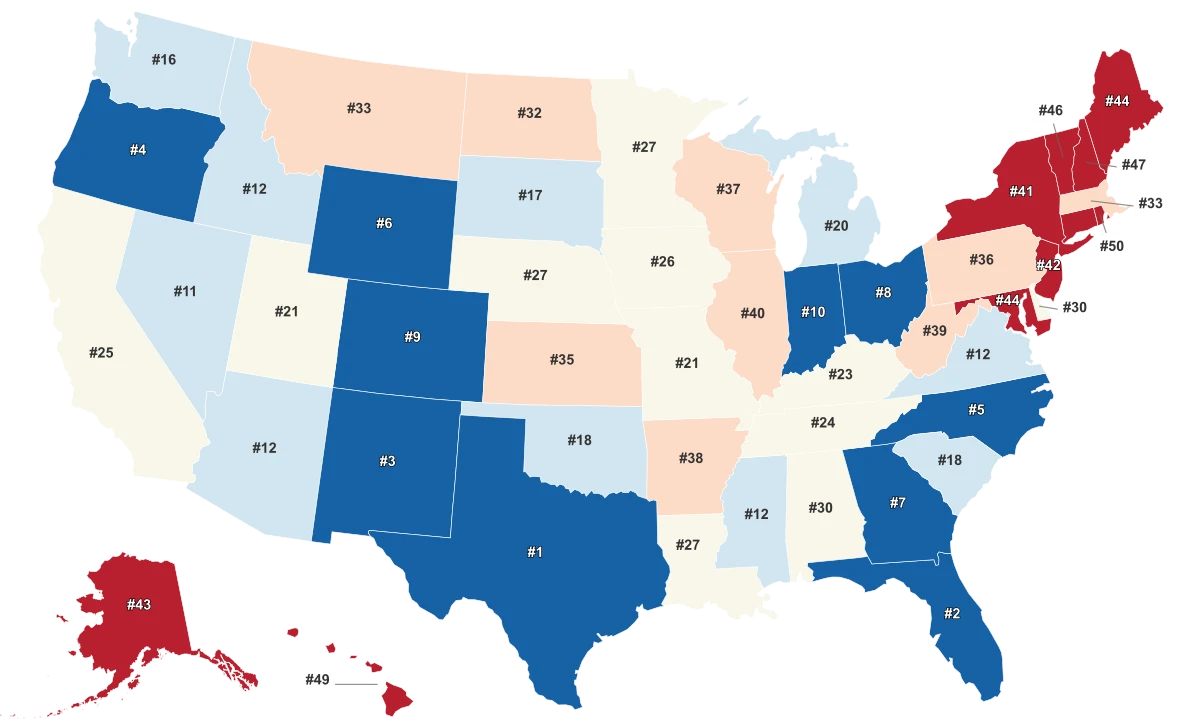
Recreation and Entertainment (25%)
- Portion of State Designated for Parks and Wildlife: Double Weight (2.5 Points) - Measures the percentage of the state dedicated to parks.
- Percentage Of State Covered with Water: Single Weight (1.3 Points) - Indicates the proportion of the state's area covered by water.
- Shoreline Mileage: Half Weight (0.6 Points) - Quantifies the length of the state's shoreline.
- Nature Parks Per Capita: Single Weight (1.3 Points) - Measures the number of nature parks per capita.
- Fitness and Recreational Sports Centers Per Capita: Single Weight (1.3 Points) - Assesses the availability of fitness centers per capita.
- Motion Picture Theaters (except DriveIns) Per Capita: Single Weight (1.3 Points) - Evaluates the number of movie theaters per capita.
- Golf Courses and Country Clubs Per Capita: Single Weight (1.3 Points) - Measures the number of golf courses and country clubs per capita.
- Drinking Places (Alcoholic Beverages) Per Capita: Double Weight (2.5 Points) - Assesses the number of bars and clubs per capita.
- Promoters of Performing Arts, Sports, and Similar Events without Facilities: Double Weight (2.5 Points) - Measures the number of event promoters per capita.
- Casinos (except Casino Hotels) Per Capita: Half Weight (0.6 Points) - Evaluates the number of casinos per capita.
- Restaurants and Other Eating Places Per Capita: Double Weight (2.5 Points) - Assesses the number of restaurants per capita.
- Arcades Per Capita: Half Weight (0,6 Points) - Measures the number of arcades per capita.
- Theaters Per Capita: Single Weight (1.3 Points) - Quantifies the number of performing arts theaters per capita.
- Amusement and Theme Parks Per Capita: Half Weight (0.6 Points) - Evaluates the number of amusement parks per capita.
- Bowling Centers Per Capita: Single Weight (1.3 Points) - Measures the number of bowling centers per capita.
- Skiing Facilities Per Capita: Half Weight (0.6 Points) - Assesses the availability of skiing facilities per capita.
- Zoos and Botanical Gardens Per Capita: Single Weight (1.3 Points) - Evaluates the number of zoos and botanical gardens per capita.
- Museums Per Capita: Single Weight (1.3 Points) - Measures the number of museums per capita.
- Sports Teams and Clubs Per Capita: Half Weight (0.6 Points) - Assesses the number of sports teams and clubs per capita.
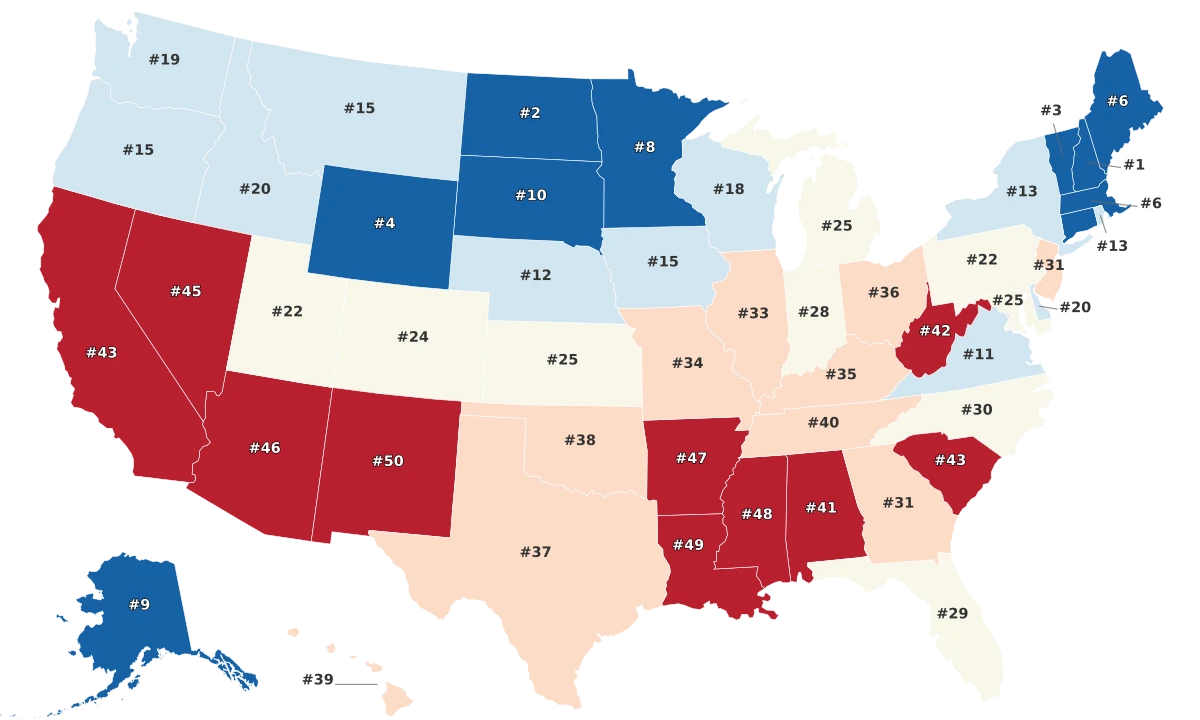
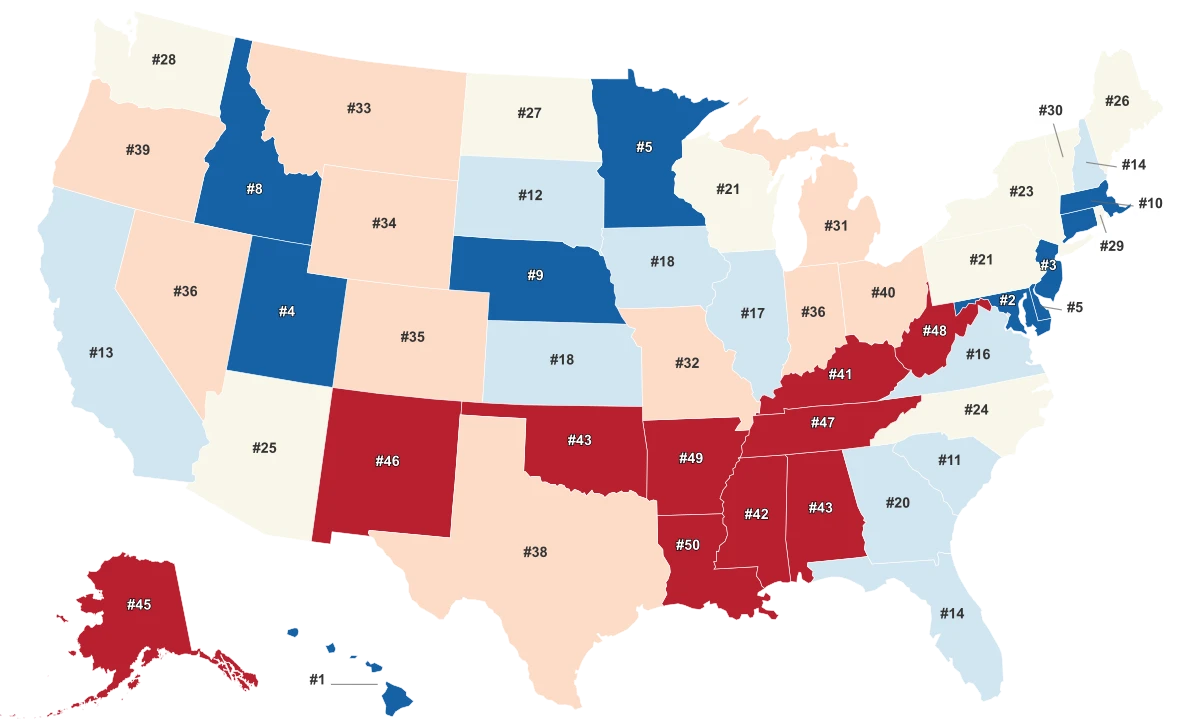
Diversity, Support, and Resources (35%)
- Diversity Score: Double Weight (6.7 Points) - Evaluates the diversity level in the state.
- Family & Relationship Wellness: Single Weight (3.3 Points) - Measures the support for family and relationship wellness.
- Rate of Mental Health Providers: Single Weight (3.3 Points) - Assesses the availability of mental health providers.
- LGBTQ Population Per 100k: Half Weight (1.7 Points) - Measures the LGBTQ population per 100,000 residents.
- Anti-Discrimination Laws: Single Weight (3.3 Points) - Evaluates the presence and strength of anti-discrimination laws.
- Hate Crime Laws: Single Weight (3.3 Points) - Assesses the state's hate crime laws.
- Individual and Family Services Per Capita: Single Weight (3.3 Points) - Measures the availability of social assistance services.
- Offices of Mental Health Practitioners Services Per Capita: Double Weight (6.7 Points) - Evaluates the availability of therapy and counseling services.
- Religious Freedom Protection: Single Weight (3.3 Points) - Assesses the level of religious freedom protection in the state.