Generation Z Across the U.S
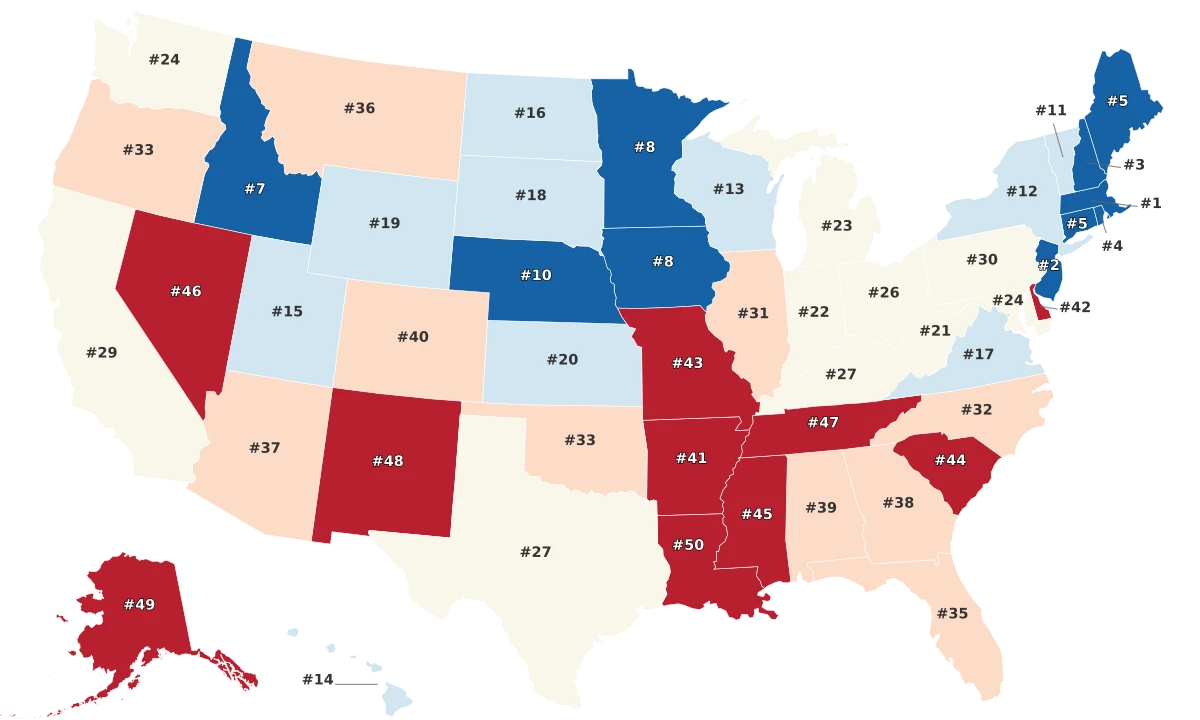
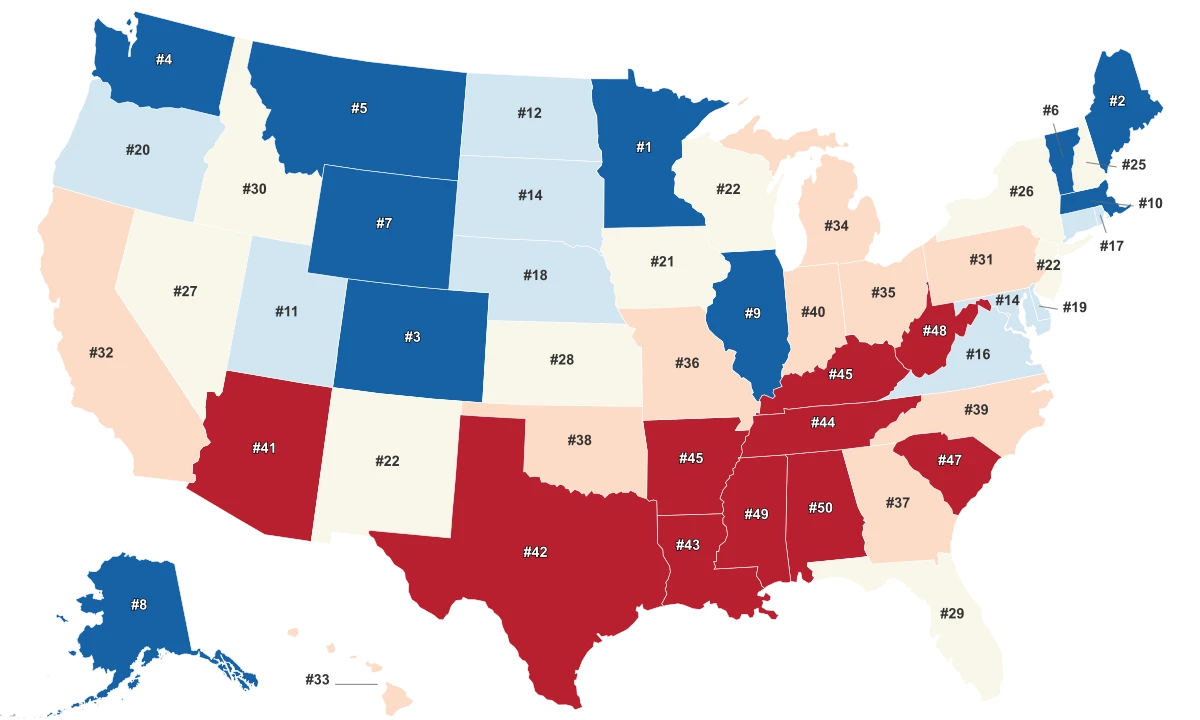
Generation Z, the youngest and most global of recent generations, is at the forefront of modern changes. Accordingly, their needs and preferences in terms of living conditions, job markets, and community engagement differ greatly from those of older generations. In the United States, various factors, including geography, regional policies, and local economies tend to dictate quality of life for Gen Z individuals. Key insights from the data include: - The best states for Gen Z are scattered throughout the country, from New Hampshire on the East Coast to Washington on the West Coast, showing that successful strategies for attracting and retaining Gen Z can happen nationwide. - Upper Midwest tends to have a stronger showing among the favorable states for Gen Z with Minnesota, Nebraska, and Wisconsin scoring highly. This could be attributed to better healthcare accessibility, strong educational institutions, and a generally robust infrastructure. - Southern states, including Mississippi, Alabama, and West Virginia, score least favorably. This is indicative of challenges such as lower youth employment rates, a lack of access to broadband necessary for the digitally-connected Gen Z, and less inclusivity. - States with a higher focus on outdoor activities such as Utah, Colorado, and Minnesota are faring better with Gen Z, possibly signifying this generation's inclination towards work-life balance and a healthier lifestyle.
Methodology
To identify the "Best and Worst States for Gen Z" the study compared the 50 states across four primary categories:
- Quality of Life
- Wellness
- Work and Education
- **Affordability ** Each category was defined by specific metrics that reflect the respective aspects. A total of 29 metrics were used, each graded on a 100-point scale, with 100 representing the optimal condition for couples. Each metric had states scores distributed from 0 to 100. Each state's weighted average was then calculated across all metrics to determine category scores, which were summed to generate the final state rankings.
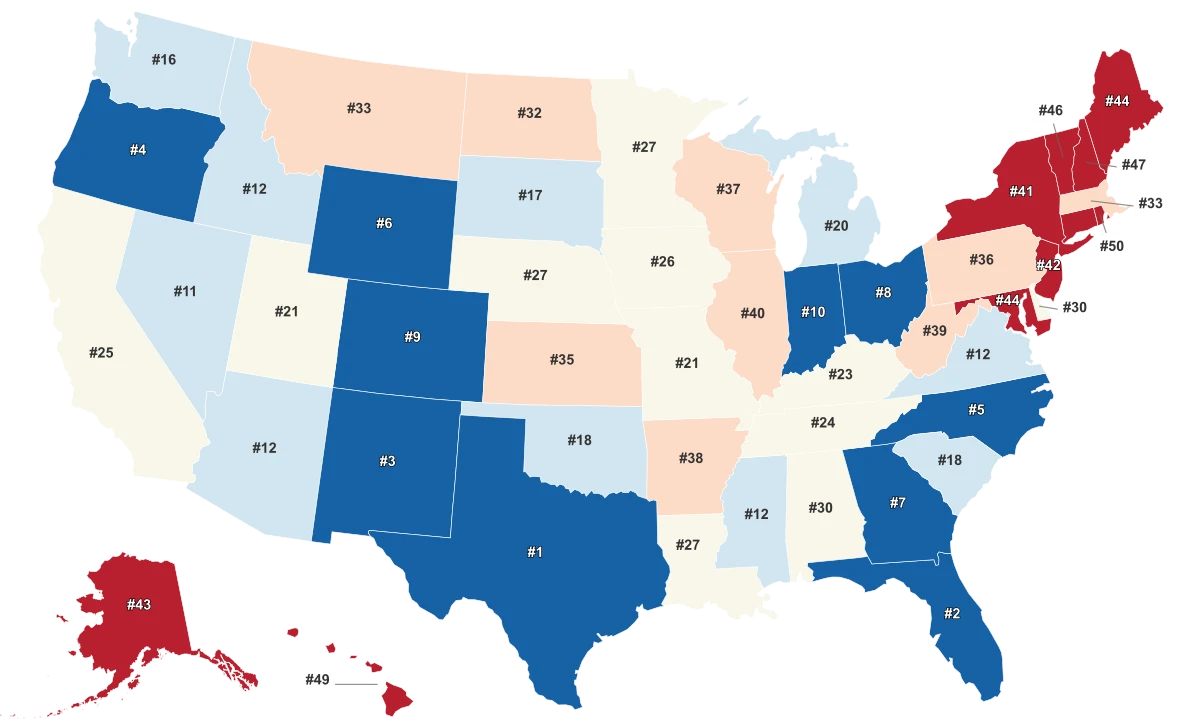
Quality of Life (35 %)
- **Bars and Clubs: Single Weight (3.7 points)- **Assesses the number of bars and clubs per capita.
- **Promoters and Performing Arts Providers: Half Weight (1.8 points) - **Measures the number of event promoters per capita.
- **Nature Parks Per Capita: Single Weight (3.7 points) - **Measures the percentage of the state dedicated to parks.
- **Restaurants per Capita: Double Weight (7.4 points) - **Assesses the number of restaurants per capita.
- **Theaters per Capita: Half Weight (1.8 points) - **Quantifies the number of performing arts theaters per capita.
- **Gen Z Population: Single Weight (3.7 points) - **Measures the population of Gen Z individuals per state.
- **Museums per Capita: Half Weight (1.8 points) - **Measures the number of museums per capita.
- **Safety Index Score: Double Weight (7.4 points) - **Evaluates the general safety of the state.
- **Air Quality Index: Single Weight (3.7 points) - **Measures the level of air pollution per state.
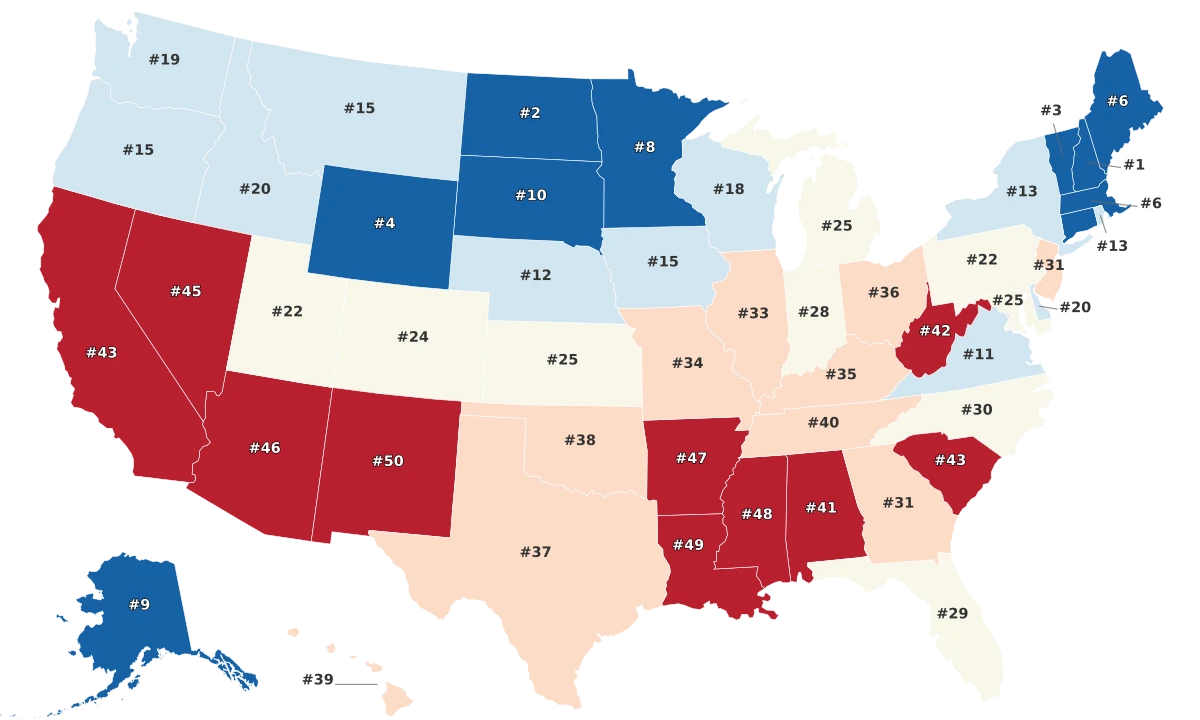
Wellness (30 %)
- **Fitness and Sports Centers per Capita: Single Weight (3.8 points) - **Assesses the availability of fitness centers per capita.
- **Mental Health Providers: Double Weight (7.5 points) - **Assesses the availability of mental health providers.
- **Teen Alcohol Use: Single Weight (3.8 points) - **Measures the number of teenage alcohol drinkers.
- **Teen Drug Use: Single Weight (3.8 points) - **Measure the number of teenage drug users.
- **Teen Obesity: Double Weight (7.5 points) - **Percentage of children ages 10 to 17 who have obesity.
- **Teen Smoking: Single Weight (3.8 points) - **Measures the number of teenage smokers.
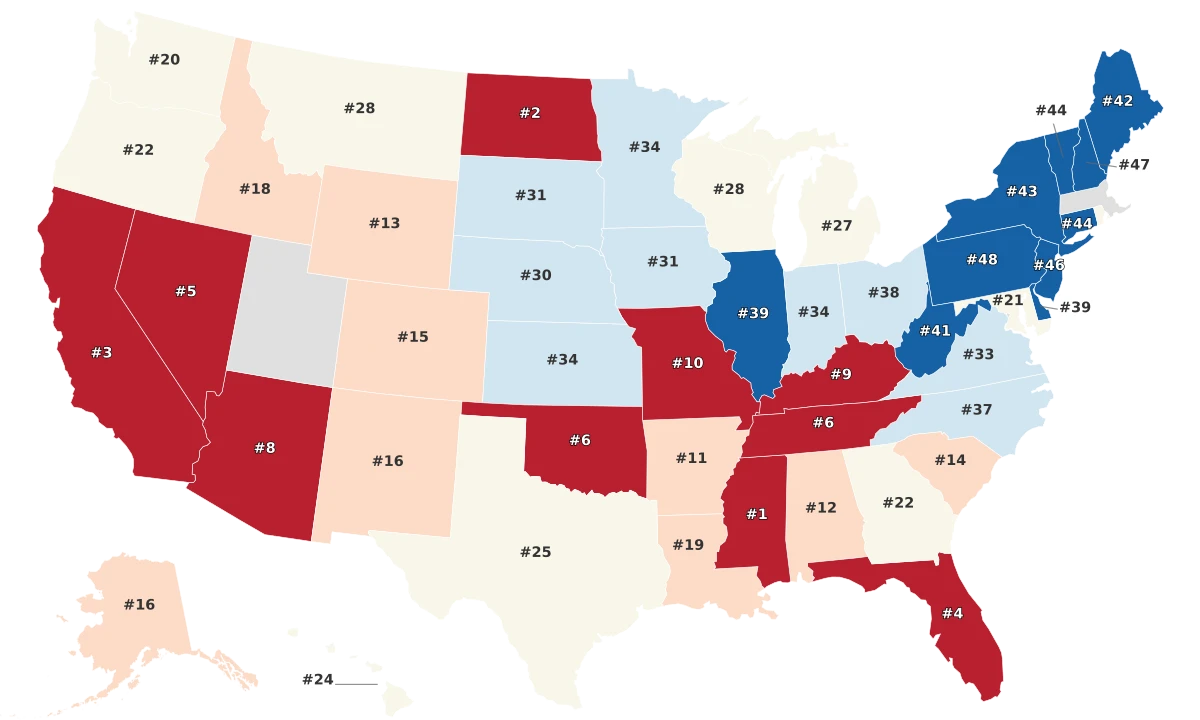
Work and Education (25 %)
- **Unemployment Rate: Single Weight (2.8 points) - **Measures the rate of unemployment for individuals that are 20 to 24 years old.
- **Median Internet Speed: Half Weight (1.4 points) - **Measures the internet speed per state.
- **High School Completion: Single Weight (2.8 points) - **Measures the percentage of individuals ages 25 with at least a high school diploma or equivalent.
- **Education Quality Index: Single Weight (2.8 points) - **Measures the quality of education per state.
- **GenZ Median Hourly Earnings: Single Weight (2.8 points) - **Measures the hourly earnings for individuals who are 16-to-24-year-olds.
- **Household Income For Individuals Under 25: Double Weight (5.6 points) - **Measures the household income of individuals who are under 25 years old.
- **College Enrollment Per Capita: Half Weight (1.4 points) - **Measure the number of high school graduates going directly to college.
- **Job Growth: Single Weight (2.8 points) - **Represents the percentage of job opportunities per state.
- **Job Openings: Single Weight (2.8 points) - **Represents the rate of job openings per state.
Affordability (10 %)
- **Transportation Cost: Single Weight (1.5 points) - **Measures costs associated with transportation.
- **Median Rent: Double Weight (3.1 points) - **Represents the average price of rent per state.
- **Grocery Cost: Single Weight (1.5 points) - **Measures the cost of groceries per state.
- **Cost of Living: Double Weight (3.1 points) - **Reflects the general cost of living, including housing, food, and other essentials.
- **Utility Cost Index: Half Weight (0.8 points) - **Evaluates the cost of utilities like electricity and water per state.