Driving Quality Across the U.S
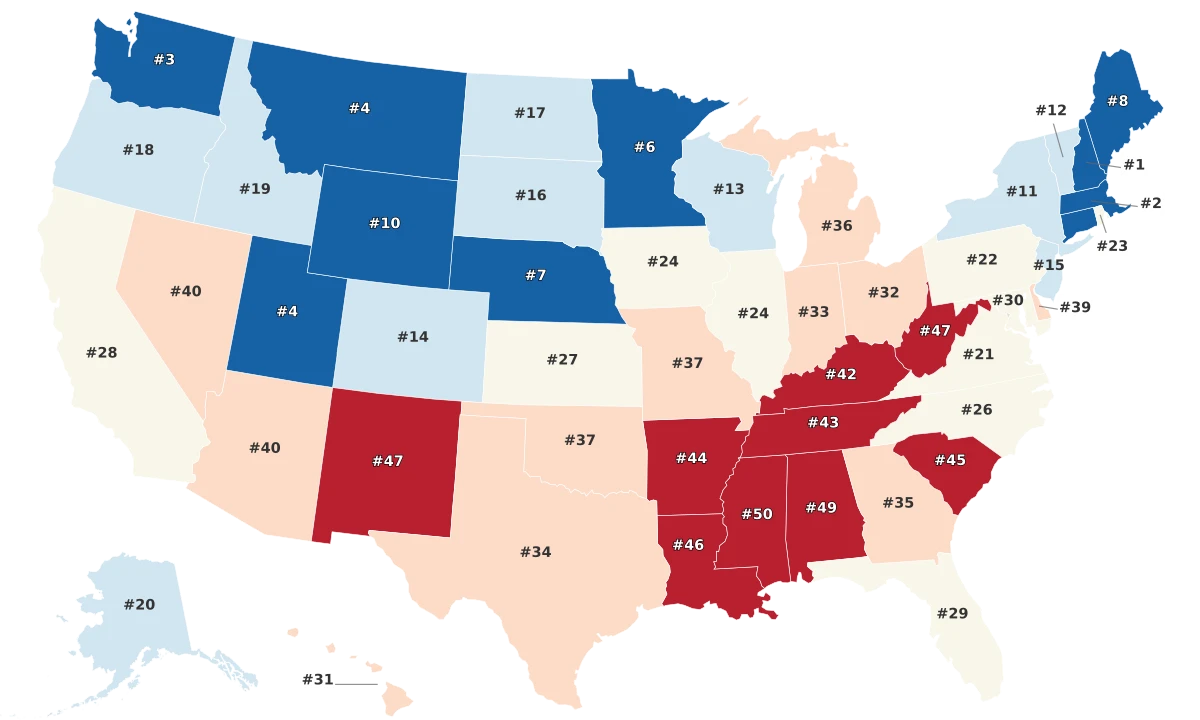
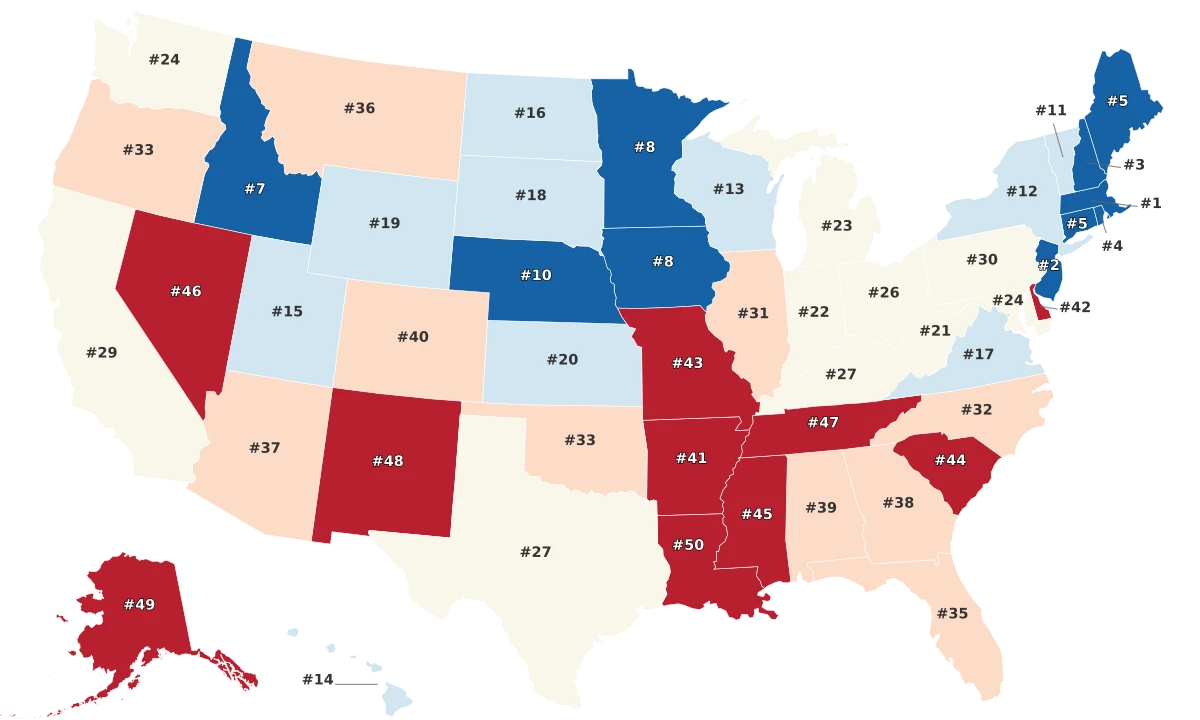
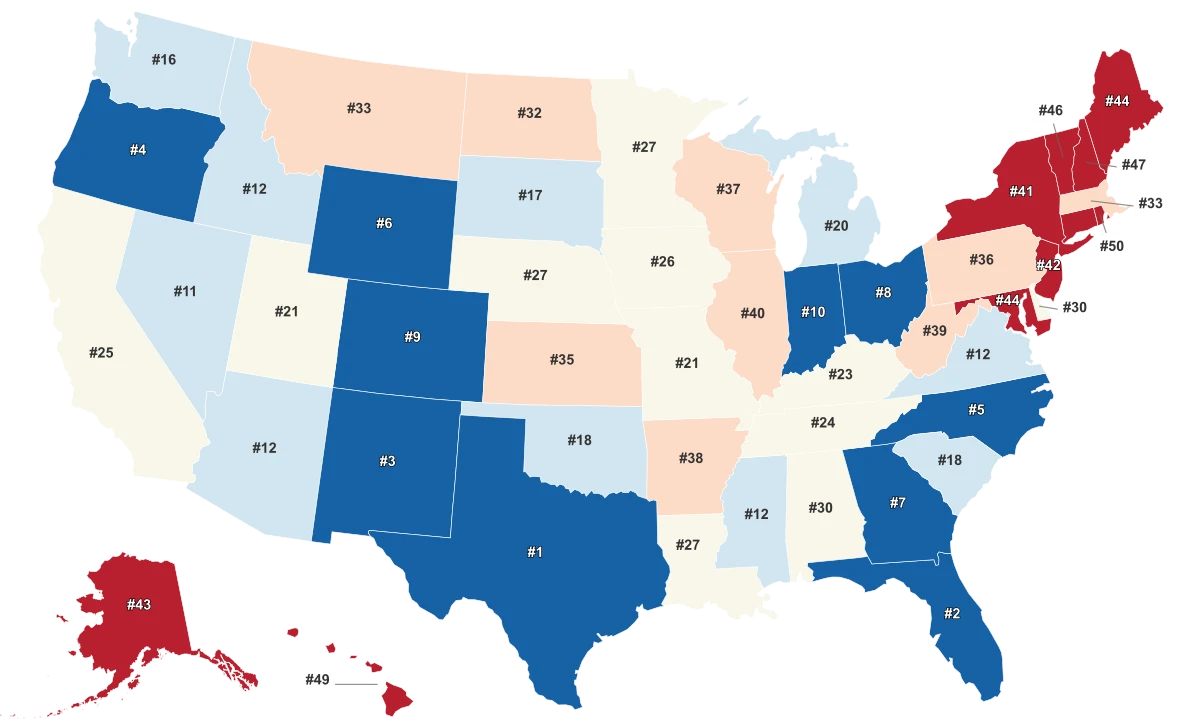
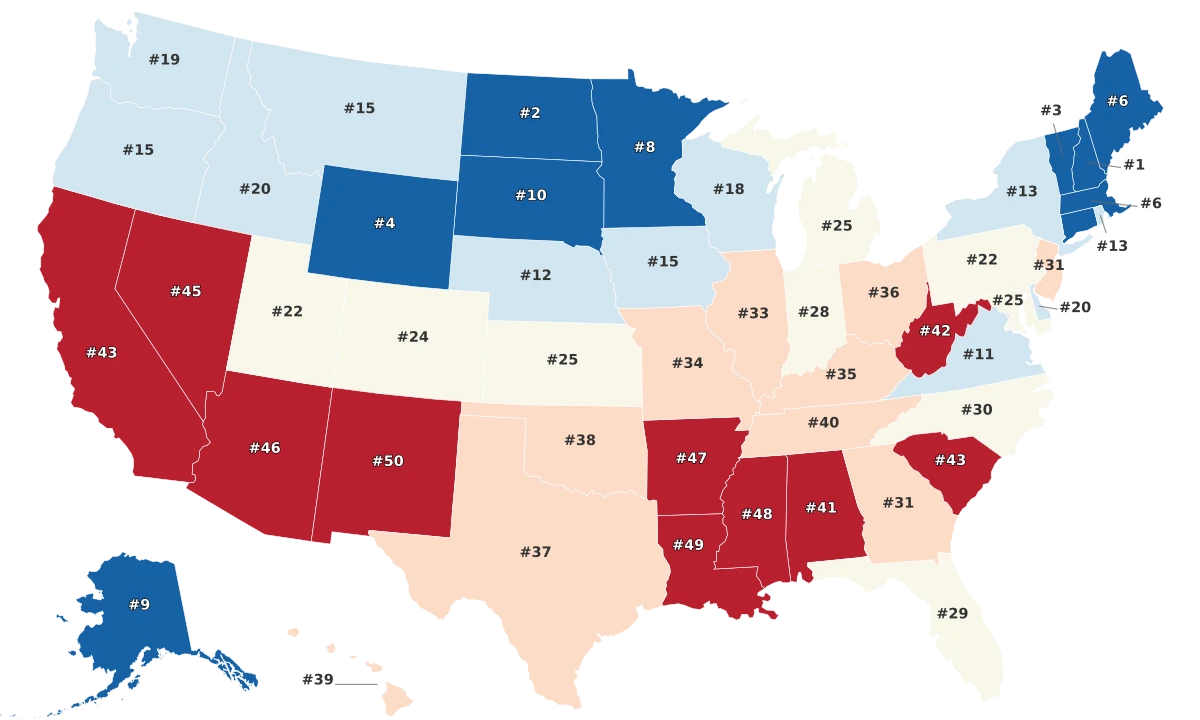
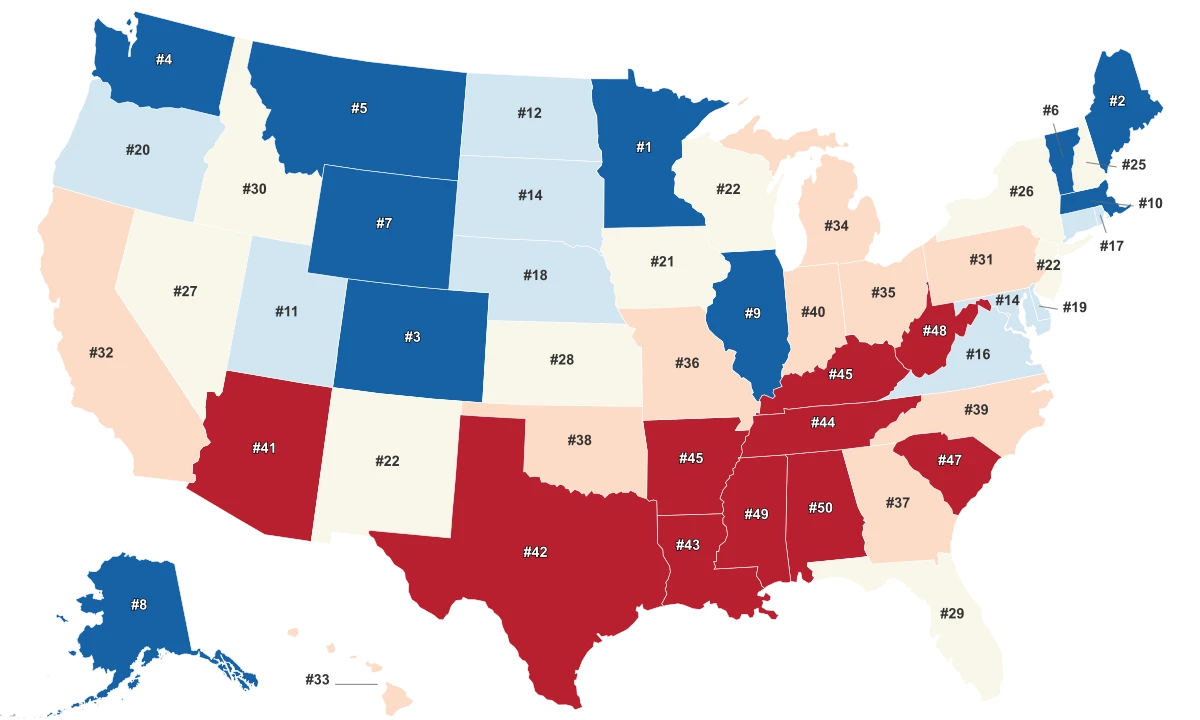
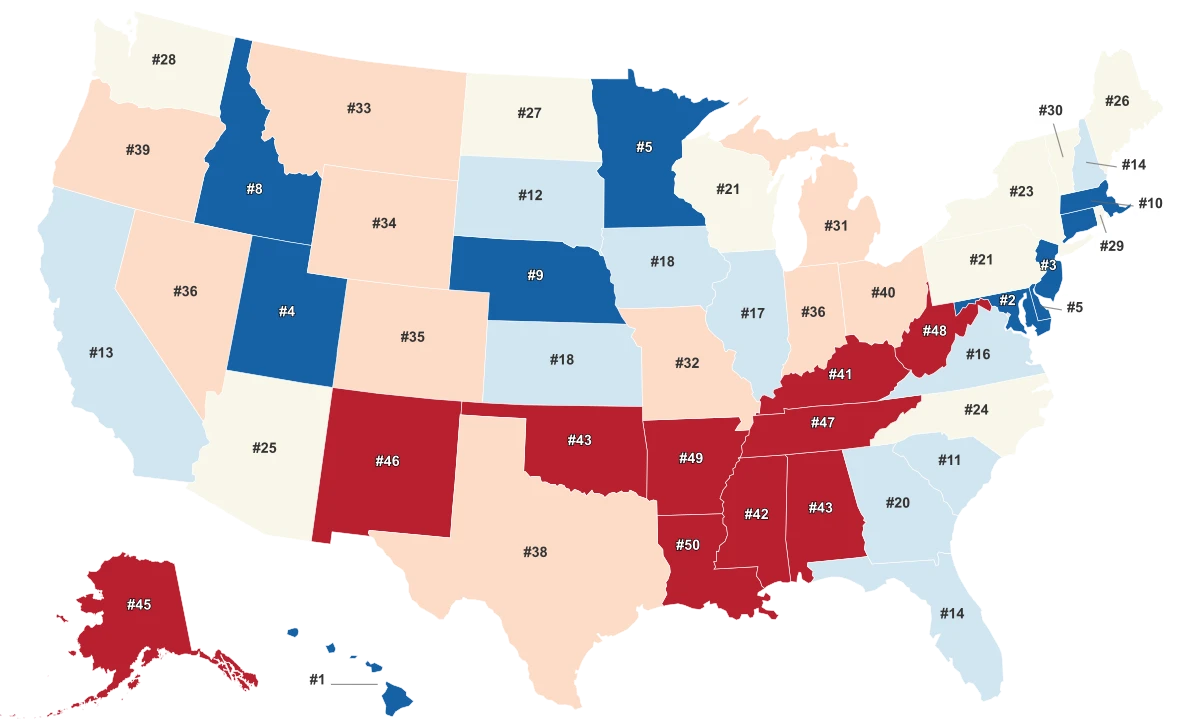
We've all experienced that moment of shock, frustration, or fear as a reckless driver zooms past us on the highway, or abruptly changes lanes without warning. It seems no matter where we are, there's always that one driver who adds a level of unnecessary risk to our daily commute. It's safe to say that all states have their fair share of bad drivers. According to the 'Bad Driver Index', there is a geographical disparity in regions recording the worst driving behaviors. The 'Bad Driver Index' ranks states on the basis of three critical criteria: percentage of insured drivers, number of Driving Under Influence (DUI) arrests per thousand drivers, and the number of fatalities per 100,000 miles driven. The coalescence of these facts provides a compelling snapshot of the dire state of road safety in some U.S. regions and the presiding factors contributing to it. Key findings from the data include:
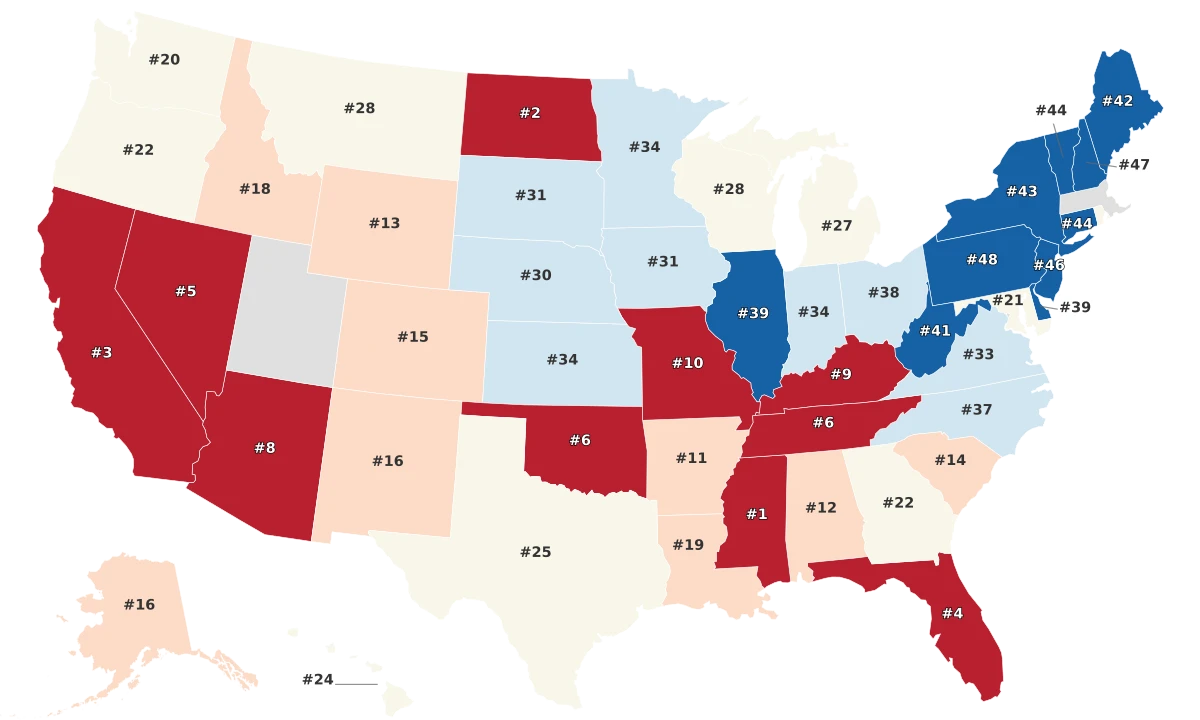
- The southern states demonstrated an alarming trend, with Mississippi leading the pack with a score of 100 - the worst, followed closely by Tennessee, Florida, and Kentucky. This regional pattern suggests a higher prevalence of unpredictable drivers in the southern part of the United States.
- North Dakota nearly caught up with Mississippi, scoring a staggering 91.3. California, notorious for its busy roads and aggressive driving, secured the third spot with a score of 90.58.
- Interestingly, the states with the least proportion of bad drivers are predominantly located in the Northeast. Pennsylvania, for instance, ranked lowest with a humbling score of 13.04. New Hampshire and New Jersey also exhibited promising figures.
- The data also revealed that some states, despite their larger population, had lower scores on the 'Bad Driving Index', such as New York with a score of 35.51, suggesting that a high population density does not necessarily translate to more bad drivers.
10 States with the Worst Drivers
Mississippi, is the state with the most dangerous driving conditions in the country.
In the second place, proving just as unpredictable and perilous, is the northern state of North Dakota, with a score of 91.3.
California, known for its substantial traffic and aggressive drivers, secured the third place on the index with an unnerving score of 90.58.
The southern state of Florida comes in fourth with a 'Bad Driver Index' of 86.96 followed by Nevada, another state notorious for deadly driving habits, scoring 84.06.
Oklahoma and Tennessee are tied for the sixth spot on the list, with disturbingly high scores of 83.33, further embodying the trend of hazardous driving behavior in the southern states.
Arizona ranks eighth with an index score of 81.88 followed by Kentucky, also in the southern crop, with a score of 78.99.
Rounding out this unhappy top ten is Missouri, completing the list with a "Bad Driver Index" of 77.54.
States with the Worst Drivers (Index Score):
- Mississippi - 100
- North Dakota - 91.3
- California - 90.58
- Florida - 86.96
- Nevada - 84.06
- Oklahoma - 83.33
- Tennessee - 83.33
- Arizona - 81.88
- Kentucky - 78.99
- Missouri - 77.54