Assessing Safety Across the States
Safety is a pivotal aspect of our lives, influencing not only our individual and familial peace of mind but also our decisions on where we choose to live, work, and raise our families. In the United States, the levels of safety differ significantly from state to state, influenced by a range of factors encompassing personal and residential safety, financial safety, road safety, workplace safety, and emergency preparedness. Though, as a country, the United States ranks 128 out of 163 countries as per the Global Peace Index, this nationwide figure disguises the range of safety levels within the constituent states. By analyzing a host of safety indicators, such as law enforcement strength, rates of DUIs, unemployment rates, assault rates, and the number of mass shootings, among others, it is possible to discern the safety landscape across the states and derive a safety score between 0 to 100 for each state, where 100 represents the highest level of safety.
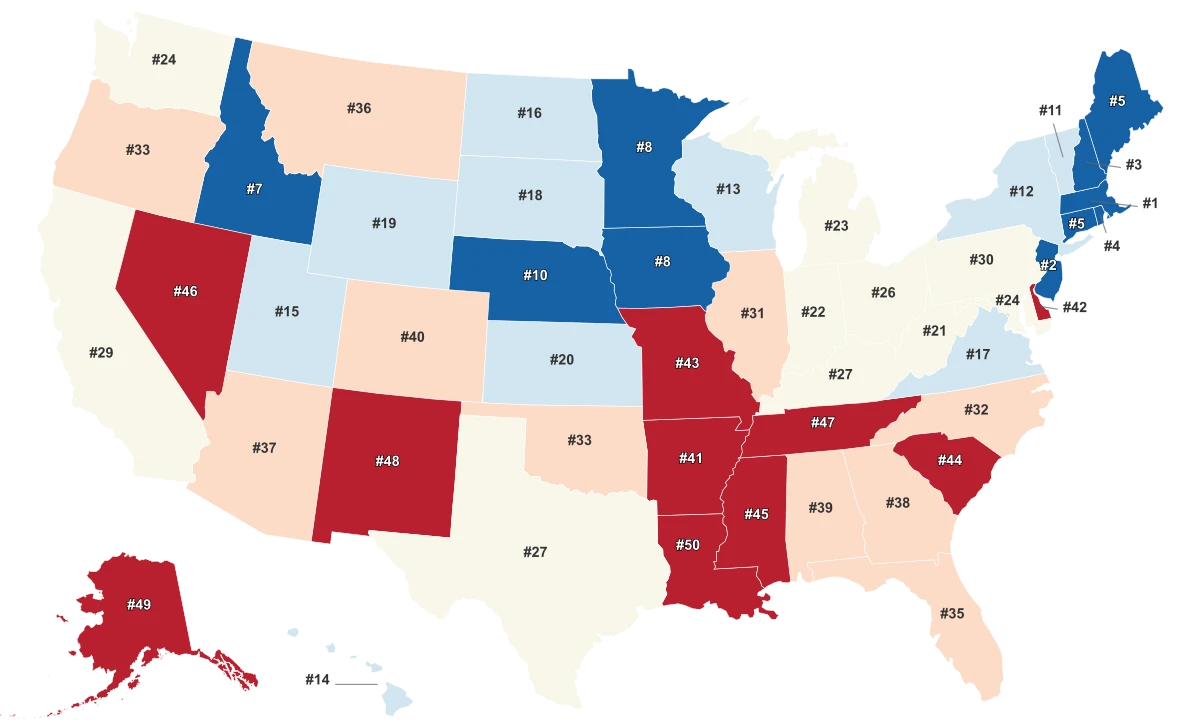
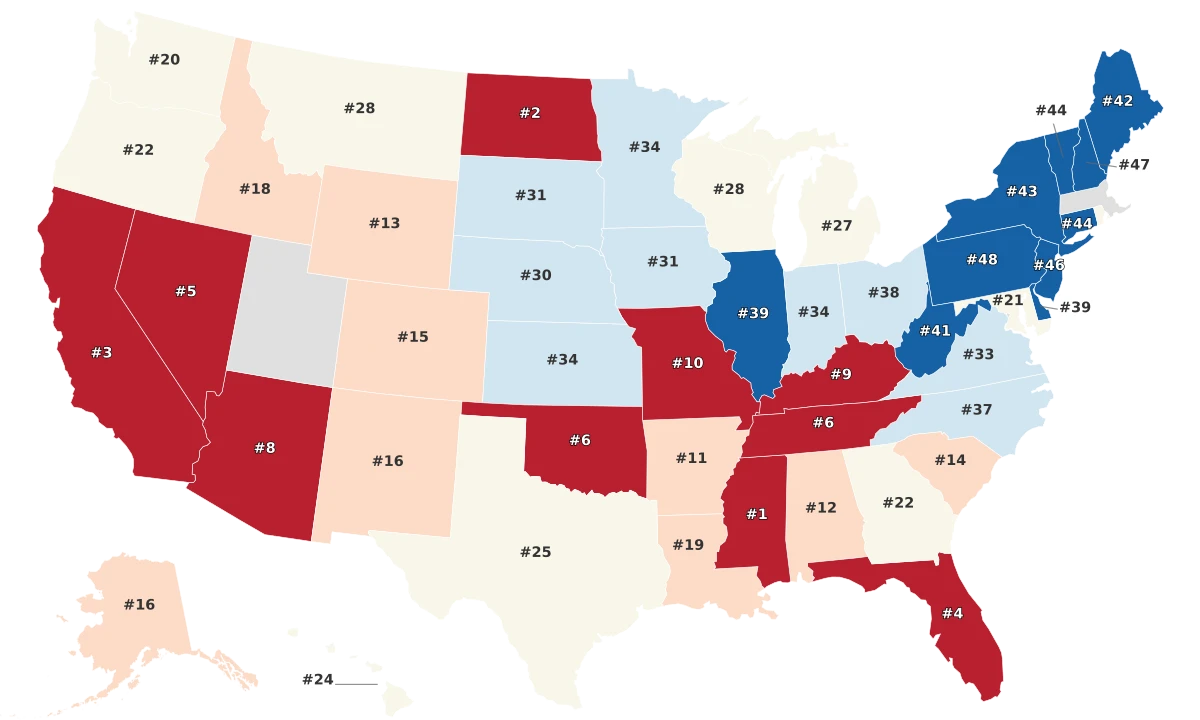
- The Northeast of the United States generally appears safer, with states like Massachusetts, New Jersey, New Hampshire, Rhode Island, and Connecticut taking place in the top five based on Safety Index Score.
- On the other hand, certain states like Louisiana and Alaska sit at the lower end of the spectrum, indicating lower safety rates.
- It's also noteworthy that larger states such as California and Texas did not feature in the top ten safest states, suggesting that population density and state size might impact the safety ratings.
- Some states have similar safety scores despite geographical differences, like Maine and Idaho, which both scored around 77.5 on the safety index.
10 Safest States
Taking a proud lead on the list is Massachusetts, scoring an impressive 80.4 on the Safety Index. Ranking second is New Jersey, with a Safety Index Score of 79.4. New Hampshire clinches the third spot with a Safety Index Score of 78.8. Its low crime rates and robust emergency preparedness plans contribute towards its high score. Following closely, Rhode Island and Connecticut both score above 77.9 on the Safety Index, placing them at the fourth and fifth ranks respectively. These states excel in maintaining a safe environment for their residents through their safety policies and implementations. Coming at sixth is Maine, matching Connecticut's score of 77.9. Known for its serene, low-populated towns, Maine has consistently ranked high in safety. In the seventh spot, Idaho bears a rating of 77.5. Despite its relative geographical isolation, Idaho has been successful in maintaining a safe and secure environment for its inhabitants. Iowa and Minnesota share the eighth spot with identical scores of 77.3. Both these states have demonstrated their ability to provide safety across various aspects from road quality to emergency preparedness. Rounding off the list is Nebraska with a score of 77.1. This heartland state embodies safety with its low crime rates and high-quality road safety.
10 Safest States
- Massachusetts - 80.4
- New Jersey - 79.4
- New Hampshire - 78.8
- Rhode Island - 78.1
- Connecticut - 77.9
- Maine - 77.9
- Idaho - 77.5
- Iowa - 77.3
- Minnesota - 77.3
- Nebraska - 77.1
Methodology
To determine the safest states the 50 states were compared across five key categories:
- Crime and Law Enforcement
- Firearms and Violence
- Welfare and Personal Security
- Safety & Social Equity
- Transportation Safety Each of these was defined via individual metrics that were representative of the category. There were a total of 32 metrics which are listed below. Each metric was graded on a 100-point scale, with a score of 100 being the max. Each metric had state scores distributed from 0 to 100. Finally, each state’s weighted average was determined across all metrics to calculate category scores. These were then summed to generate the final rank order of the states.
Crime and Law Enforcement (30%)
- **Violent Crime Rate - **Triple Weight (7.2)
- **Non-violent Crime Rate - **Regular Weight (2.4)
- **Recidivism Rate - **Regular Weight (2.4)
- **Human Trafficking Cases Rate per 100K - **Double Weight (4.8)
- **Homicides per 100k People - **Double Weight (4.8)
- **Imprisonment Rate per 100k residents - **Half Weight (1.2)
- **Police Officers per 100k - **Double Weight (4.8)
- **Assault Rate per 100k - **Regular Weight (2.4)
Firearms and Violence (25%)
- **Gun Ownership Rate - **Regular Weight (3.6)
- **Mass Shootings Rate per 100k - **Double Weight (7.1)
- **Gun Deaths per Capita - **Triple Weight (10.7)
- **Nonfatal Gun Injuries per 100k - **Regular Weight (3.6)
Welfare and Personal Security (25%)
- **Identity-Theft Complaints per Capita - **Regular Weight (2.5)
- **Fraud Complaints per Capita - **Double Weight (5.0)
- **Cyber Crime Victims per 100k - **Regular Weight (2.5)
- **Drug Death Rate - **Double Weight (5.0)
- **Property Crime Rate per 100k - **Regular Weight (2.5)
- **Larceny Thefts per 100k - **Regular Weight (2.5)
- **% of Illicit Drug Use in Adults - **Double Weight (5.0)
Safety & Social Equity (10%)
- Abortions due to Rape Rate - Regular Weight (1.0)
- **% of Domestic Violence Against Women - **Regular Weight (1.0)
- **% of Sexual Harassment - **Double Weight (2.0)
- Workers Fatality Rate per 100k - Regular Weight (1.0)
- **Hate Groups per Capita - **Double Weight (2.0)
- **Hate-Crime Incidents per Capita - **Double Weight (2.0)
- **Deaths due to Intentional self-harm per 100k - **Single Weight (1.0)
Transportation Safety (10%)
- **% of Motorcyclist Fatalities - **Regular Weight (1.2)
- Car Accidents Fatalities Rate - Double Weight (2.4)
- % of Drivers fatalities with known BAC results - Regular Weight (1.2)
- Pedestrian Fatality rate per 100k people - Double Weight (2.4)
- **% of Unrestrained Fatally Injured Occupants - **Half (0.6)
- % of Bicyclists Fatalities - Double Weight (2.4)