A Ranking Shaped by Population as Much as Violence
The numbers in this ranking come from the Institute for Health Metrics and Evaluation's Global Burden of Disease study, which estimates deaths by cause across 204 countries and territories. Stabbing deaths refer specifically to fatalities caused by sharp force injuries in the context of interpersonal violence. The 2021 estimates put the global total at roughly 82,800 deaths by stabbing, spread across 202 countries with available data.
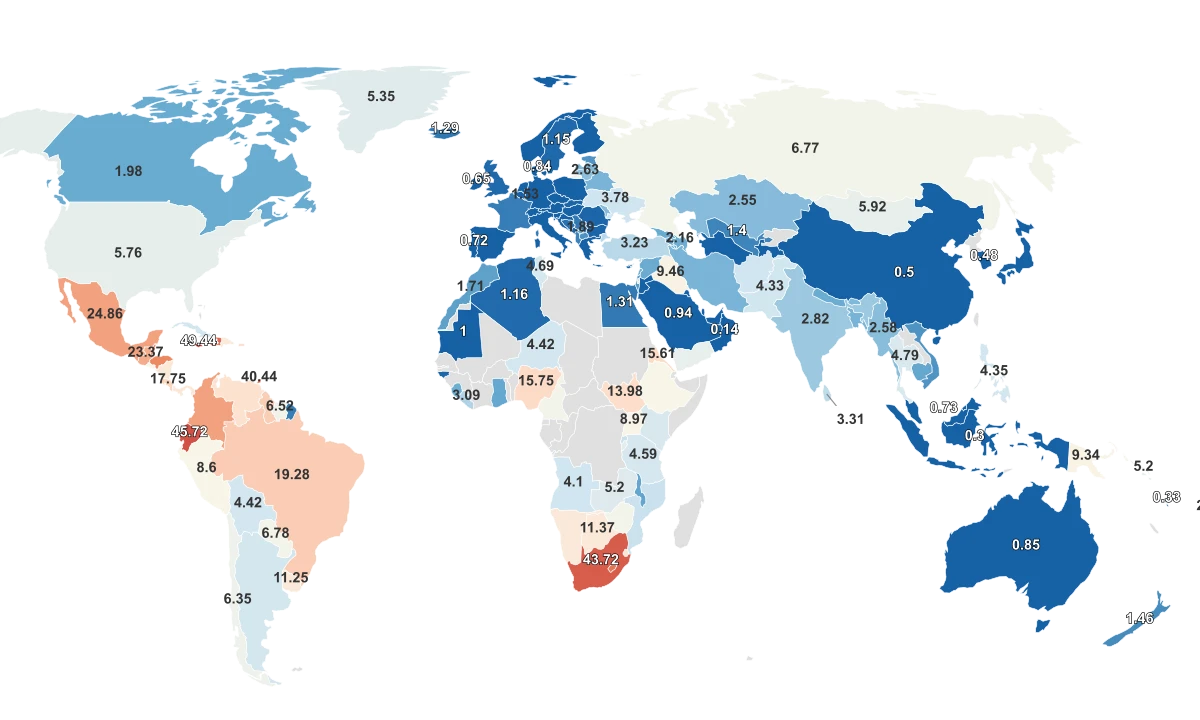
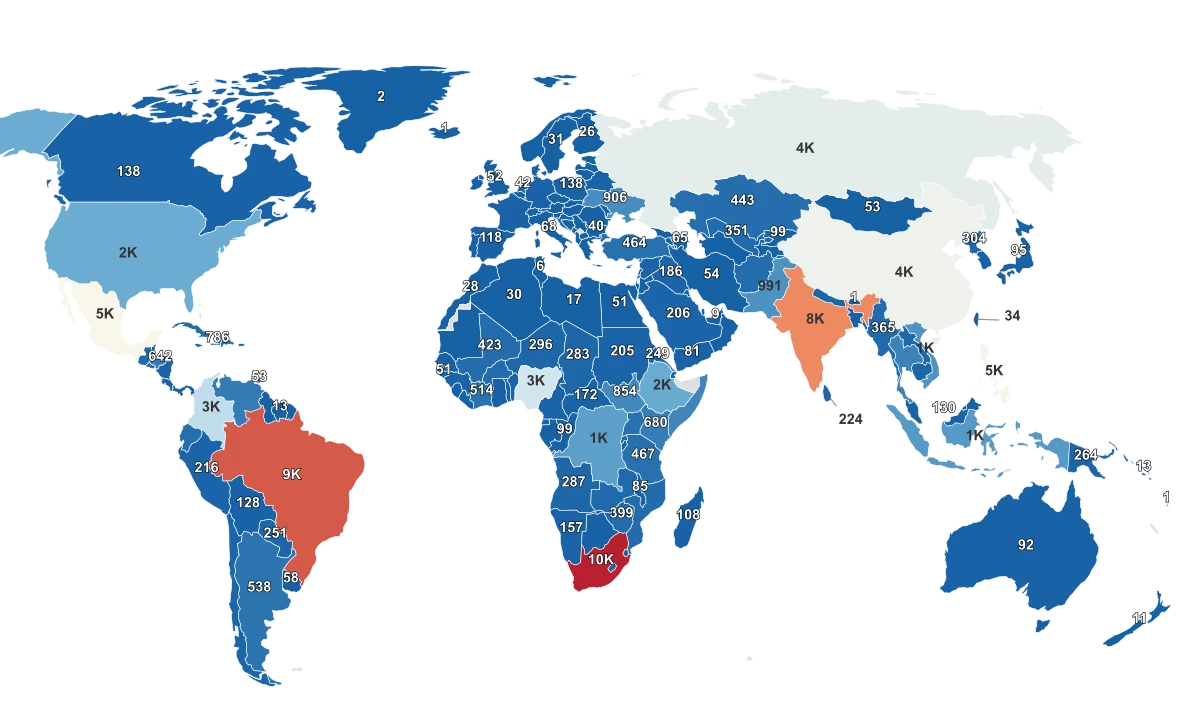
South Africa leads with 9,800 stabbing deaths. Brazil follows at 8,900, and India sits third with 8,100. Together with Mexico (4,800) and the Philippines (4,600), the top five countries account for 43.7% of all stabbing deaths worldwide. Below that top tier, the numbers fall steeply: the median country records about 52 deaths per year, and more than half the dataset sits below 100.
That concentration at the top deserves an immediate caveat. This ranking counts bodies, not rates. India records 8,100 stabbing deaths across a population of 1.4 billion. That works out to a fraction of a death per 100,000 people. China (4,300 deaths, population 1.4 billion) has one of the lowest homicide rates in the dataset at 0.5 per 100,000. These countries appear near the top not because they are exceptionally dangerous, but because they are exceptionally large.
The opposite pattern plays out in the Caribbean. Saint Kitts and Nevis records just 1 stabbing death in the GBD data but has a homicide rate of 64.16 per 100,000, the highest in this entire dataset. Jamaica records 217 stabbing deaths but a homicide rate of 49.44. Small populations with intense violence look invisible in an absolute count ranking but dominate the per-capita picture.
South Africa Leads Because the Violence Is Real, Not Just the Population
Most of the countries at the top of this list are there partly because of sheer size. South Africa is the exception. With a population of roughly 60 million, it records 9,800 stabbing deaths, more than India, a country with 23 times as many people. Its overall homicide rate of 43.72 per 100,000 ranks fifth in the dataset, behind only small Caribbean island nations.
The structural drivers behind that number trace directly to the country's history. South Africa carries one of the highest Gini coefficients in the world, roughly 0.63, meaning income inequality there is more extreme than nearly anywhere else. The spatial legacy of apartheid concentrated Black South Africans into under-resourced townships and informal settlements, where unemployment can exceed 40% and community institutions are weak. Research from the Institute for Security Studies in Pretoria has repeatedly found that most South African homicides are not gang hits or organized crime. They are interpersonal: arguments between people who know each other, often fueled by alcohol.
Knives dominate those encounters because they are universally available. Procuring a firearm in South Africa requires navigating a licensing process or the black market. A kitchen knife is already in the house. The country's Medical Research Council has documented that sharp force injuries are the leading mechanism of homicide in multiple provinces, ahead of both firearms and blunt objects.
Brazil (8,900 deaths) and Mexico (4,800) round out the top three by volume, but their per-capita homicide rates of 19.28 and 24.86 per 100,000, while high, are less than half of South Africa's. Both countries also have much larger populations diluting the rate. And in both Brazil and Mexico, firearms, not knives, are the primary homicide weapon. Their stabbing totals are enormous because the overall violence is enormous.
Where Guns Are Scarce, Knives Fill the Gap
One of the clearest patterns in this data only becomes visible when you stop looking at the ranking by absolute count and start comparing it against the homicide rate. The two metrics show almost no statistical relationship with each other.
Stabbing Deaths and Homicide Rates Move Almost Independently
Countries with thousands of stabbings can have low per-capita murder rates, while the most dangerous per-capita nations record only a handful of knife deaths.
The reason is structural. In countries where firearms are widely available, guns are the primary killing mechanism, and stabbings make up a small fraction of total homicides. In countries where gun access is tightly restricted, knives become the dominant weapon by default, but overall homicide rates tend to be much lower because knives are less lethal per assault.
Japan records 95 stabbing deaths and a homicide rate of just 0.23 per 100,000, one of the lowest in the world. The United Kingdom records 52 deaths and a rate of 1.15. Both countries have strict firearms regulations, and in both, knife attacks represent a disproportionately high share of their relatively small homicide totals. The UK's Office for National Statistics has reported that sharp instruments are the most common method of homicide in England and Wales in most recent years.
The United States offers the inverse. It records 1,800 stabbing deaths, a number that places it 10th in this ranking. But its overall homicide rate of 5.76 per 100,000 is five times higher than the UK's. The difference is guns: the FBI's Uniform Crime Report consistently shows that firearms account for roughly 75% of all American homicides. If the US had the UK's gun access restrictions but the same underlying violence, the stabbing total might rise, but the overall death toll would almost certainly fall. Research from the University of Chicago Crime Lab has shown that the death rate per 100 gun assaults is substantially higher than the rate per 100 knife assaults.
What These Numbers Can and Cannot Tell You
The stabbing death estimates in this ranking do not come from police blotters or courtroom records. They come from the Global Burden of Disease project at the University of Washington's Institute for Health Metrics and Evaluation, which uses a statistical modeling framework called CODEm. The model integrates vital registration systems, medical examiner data, and cause-of-death surveillance, then fills gaps in countries where death reporting is incomplete.
That modeling step matters. In countries with robust vital registration, like Japan, the UK, or Australia, the GBD estimates hew closely to official statistics. In countries with weak registration systems, like Nigeria (3,400 estimated deaths), DR Congo (1,200), or Ethiopia (1,600), the estimates rely more heavily on the model. The numbers are the best available global comparison, but they are estimates, not counts, and the uncertainty is larger in places where the underlying data is thinnest.
The Homicide Rate data comes from a different source entirely: the United Nations Office on Drugs and Crime, which compiles reported homicide statistics from national criminal justice and public health systems worldwide. These figures cover all homicide methods, not just stabbings, and are expressed per 100,000 population.
The most important caveat is the ranking itself. Sorting countries by total stabbing deaths tells you about volume, not risk. A reader in China (4,300 deaths, 0.5 per 100,000 homicide rate) faces a vanishingly small personal risk of knife violence, far lower than a resident of Lesotho (267 deaths, 38.24 per 100,000). The table ranks by the biggest numbers. The per-capita column tells you where the danger actually concentrates.