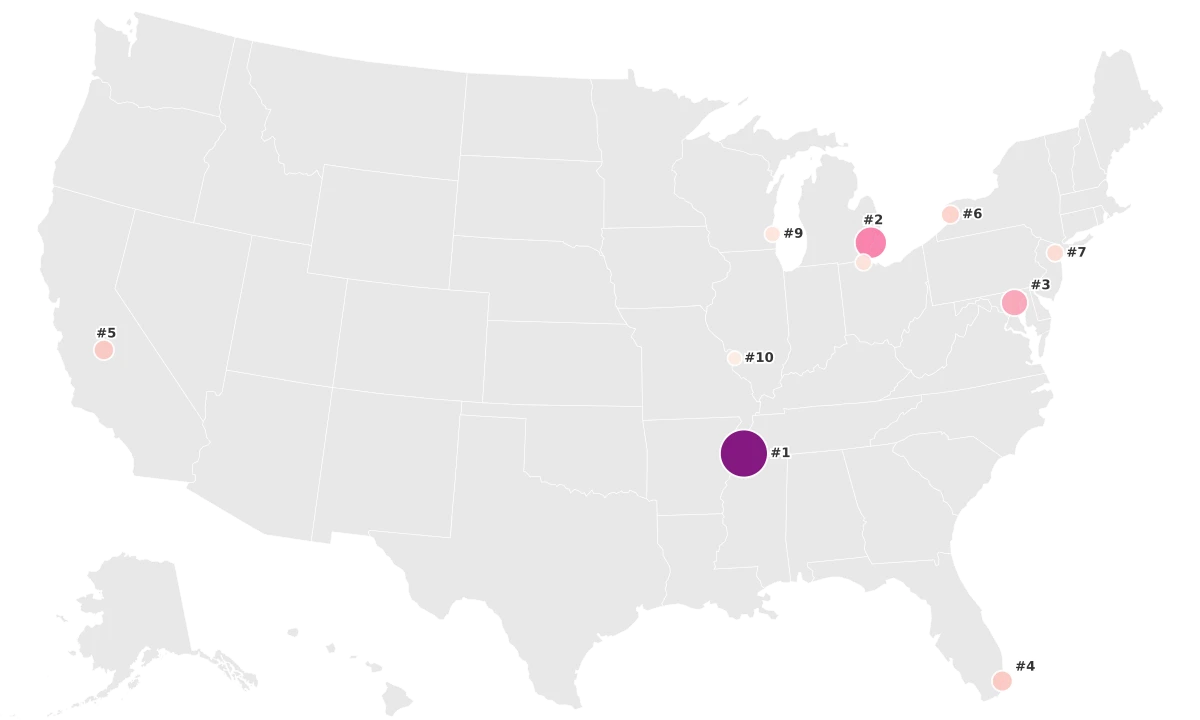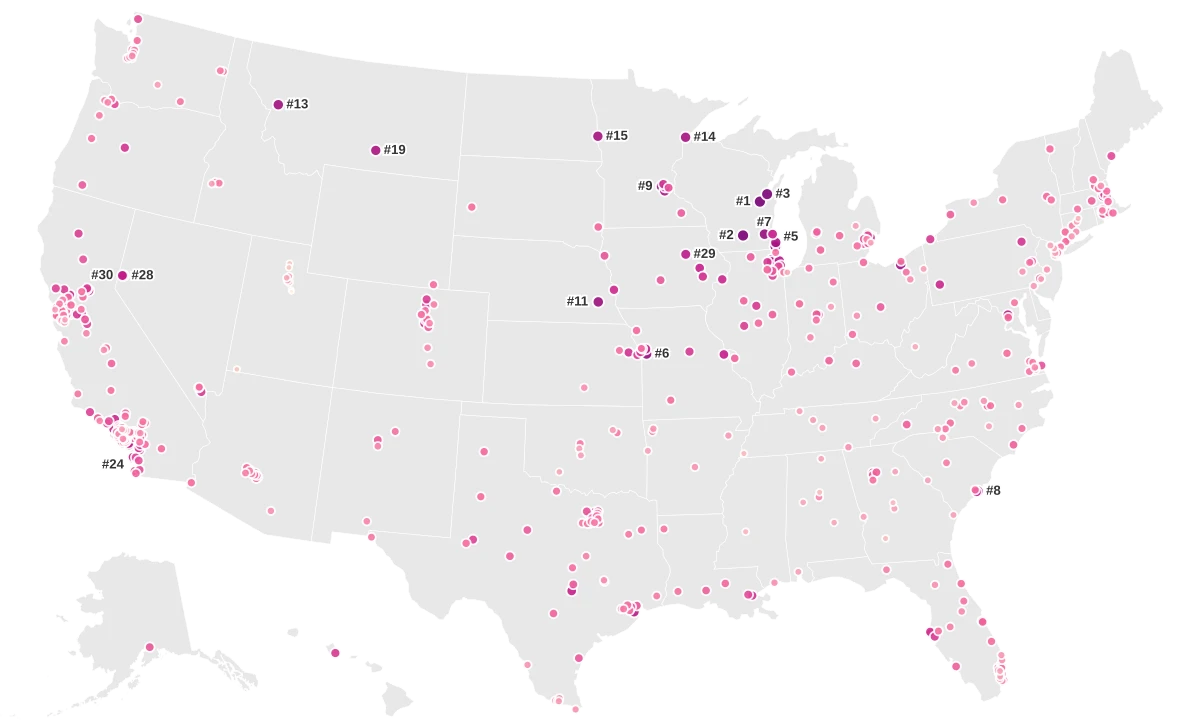
Wisconsin Owns the Top of This List
If you picked a random bar in Appleton, Wisconsin on a Friday night, there is a better chance someone at that bar just binge drank than in almost any other city in America. Appleton and Madison share the top spot at 25.4% of adults reporting binge drinking, according to the CDC's 500 Cities Project, which used 2017 data from the Behavioral Risk Factor Surveillance System. Binge drinking means four or more drinks on a single occasion for women, five or more for men, at least once in the past 30 days.
Green Bay and Arlington Heights, Illinois are tied right behind at 25.0%. Kenosha sits at 24.4%. Waukesha hits 23.7%. All seven Wisconsin cities in the dataset fall in the top 20% of the ranking. No other state comes close to that kind of statewide dominance.
At the bottom, the picture flips completely. Provo, Utah reports just 6.2%, less than one-quarter of Appleton's rate. Orem follows at 6.8%. Five of the ten lowest-ranked cities are in Utah. The gap between the top and bottom of this ranking is 19.2 percentage points, but the middle is remarkably compressed: the mean and median are both 17.7%, and most cities cluster within a few points of that number.
The Midwest and the Northern Plains own the top of the ranking. Wisconsin, Minnesota, Iowa, Montana, North Dakota, and Nebraska all place cities in the top 50. The bottom is split between Utah and the Deep South. The reasons those two groups land in the same statistical neighborhood could not be more different.
The Drunkest Cities Are Not the Unhealthiest
The most counterintuitive finding in this data is what binge drinking does NOT correlate with. In most people's imagination, the "drunkest" cities would also be the cities with the worst health outcomes. The opposite is closer to the truth.
Binge drinking runs in the opposite direction from both smoking and poor mental health across these 500 cities. Cities with the highest binge drinking rates tend to have the lowest smoking rates and the lowest rates of poor mental health days. Cities with the lowest binge drinking rates, outside Utah, tend to have the highest smoking and mental health burdens.
The numbers are stark. Plymouth, Minnesota reports one of the highest binge drinking rates in the country at 23.6%. Its smoking rate is just 11.3%, and its rate of poor mental health is 8.3%, the lowest of any city in the entire dataset. Madison pairs its 25.4% binge drinking rate with a smoking rate of 13.7% and a poor mental health rate of just 10.8%. The pattern repeats in Arlington Heights: heavy binge drinking, low smoking, low mental health distress.
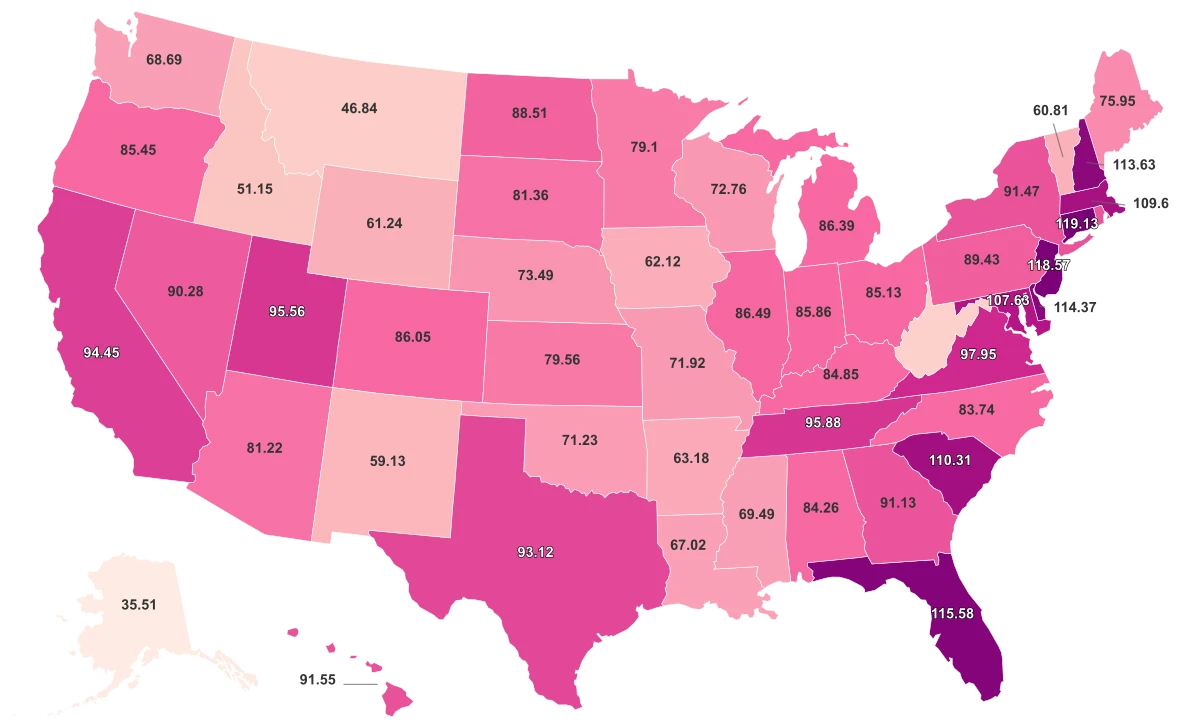
The Cities That Drink the Most Report the Fewest Poor Mental Health Days
Binge drinking rates run in the opposite direction from poor mental health across all 500 cities in the CDC dataset.
Now compare that to the other end. Macon, Georgia has one of the lowest binge drinking rates at 11.6%, but its smoking rate is 24.9% and its poor mental health rate is 16.6%. Memphis follows the same pattern: low binge drinking at 11.7%, paired with a 24.6% smoking rate. Birmingham looks nearly identical. Across the bottom quartile of binge drinking, outside of Utah, the same profile repeats: cities that drink less are smoking more and reporting significantly worse mental health.
The explanation is socioeconomic, not behavioral. Binge drinking in the United States tracks with income, education, and whiteness. The communities where people drink the most tend to be the ones with the strongest economic foundations. Smoking tracks the opposite direction: with poverty, lower educational attainment, and chronic stress. These are not competing vices. They are markers of very different kinds of communities.
Utah and the Deep South Anchor the Bottom for Very Different Reasons
The bottom of this ranking contains two groups of cities that arrived at low binge drinking rates through entirely different paths. One group is among the healthiest in the dataset. The other is among the most health-burdened.
Provo (6.2%) and Orem (6.8%) are both in Utah County, home to Brigham Young University and one of the highest concentrations of members of The Church of Jesus Christ of Latter-day Saints in the country. The LDS Church's health code, the Word of Wisdom, teaches abstinence from alcohol. Utah also maintains the strictest alcohol retail regulations in the country, with state-controlled liquor stores and tight licensing requirements. The cultural and regulatory effect is so strong that even Salt Lake City, which has a more diverse population, sits at just 13.5%, well below the national average.
The Utah cities also show low smoking rates and moderate mental health: Provo's smoking rate is 8.4% and its poor mental health rate is 12.6%. Orem is similar at 7.9% and 11.7%. These are communities with low substance use across the board and relatively strong overall health markers.
The Deep South tells a different story. Macon (11.6% binge drinking), Albany, Georgia (11.5%), Birmingham (11.5%), Memphis (11.7%), and Jackson, Mississippi (11.9%) all sit near the bottom for binge drinking. But their smoking rates are roughly double those of the Utah cities: Macon at 24.9%, Albany at 24.3%, Memphis at 24.6%. Their poor mental health rates are among the highest in the entire dataset. Strong religious traditions, particularly in Black church communities, are widely cited by public health researchers as protective factors against alcohol use. But the communities themselves face high poverty, limited healthcare access, and chronic stress that manifest in other health burdens.
Both groups drink little. Only one group is healthy.
What This Survey Captures and What It Misses
The binge drinking numbers in this dataset come from the BRFSS, a telephone survey in which adults are asked how many times in the past 30 days they had four or more (women) or five or more (men) drinks on one occasion. That means every number here is self-reported, and self-reporting comes with well-documented biases.
In communities where heavy drinking carries stigma, people underreport. In communities where it is normalized, people may be more open. Wisconsin's binge drinking rate may be genuinely high, but it may also be partly a measurement artifact: a culture that treats drinking as ordinary is a culture that reports it more honestly. A deeply religious community in the Deep South or in Utah may have residents who undercount or omit drinking occasions when asked on a phone survey.
The definition itself also shapes what the data captures. A person who has two glasses of wine with dinner every night does not count as a binge drinker. A person who has six beers at a single tailgate event does, even if they only do it once a month. The metric measures episodic heavy drinking, not chronic alcohol consumption or dependence. Some of the lowest-ranked cities may still have significant alcohol-related health problems that this particular measure does not pick up.
The data year is 2017, published through the CDC's 500 Cities Project. The project has since been replaced by the broader PLACES initiative, which covers more communities and uses more recent data. But the structural patterns visible here, Wisconsin on top, Utah on the bottom, the Deep South low for different reasons, have remained consistent across every BRFSS cycle for decades.