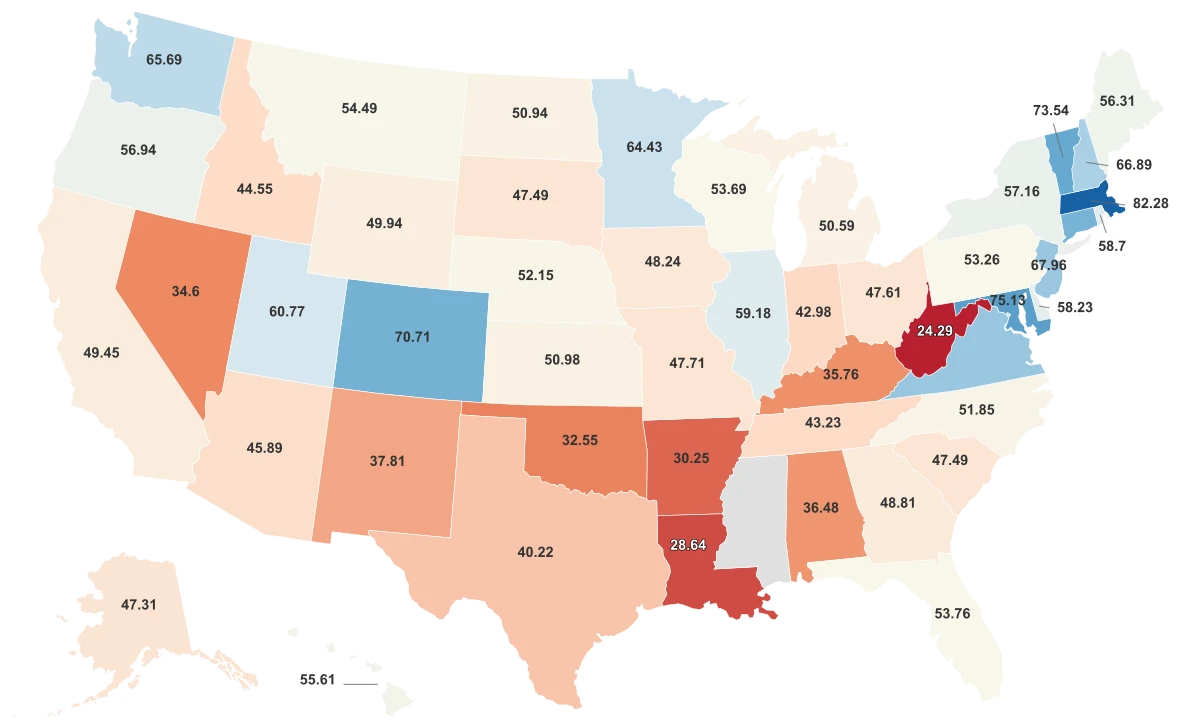
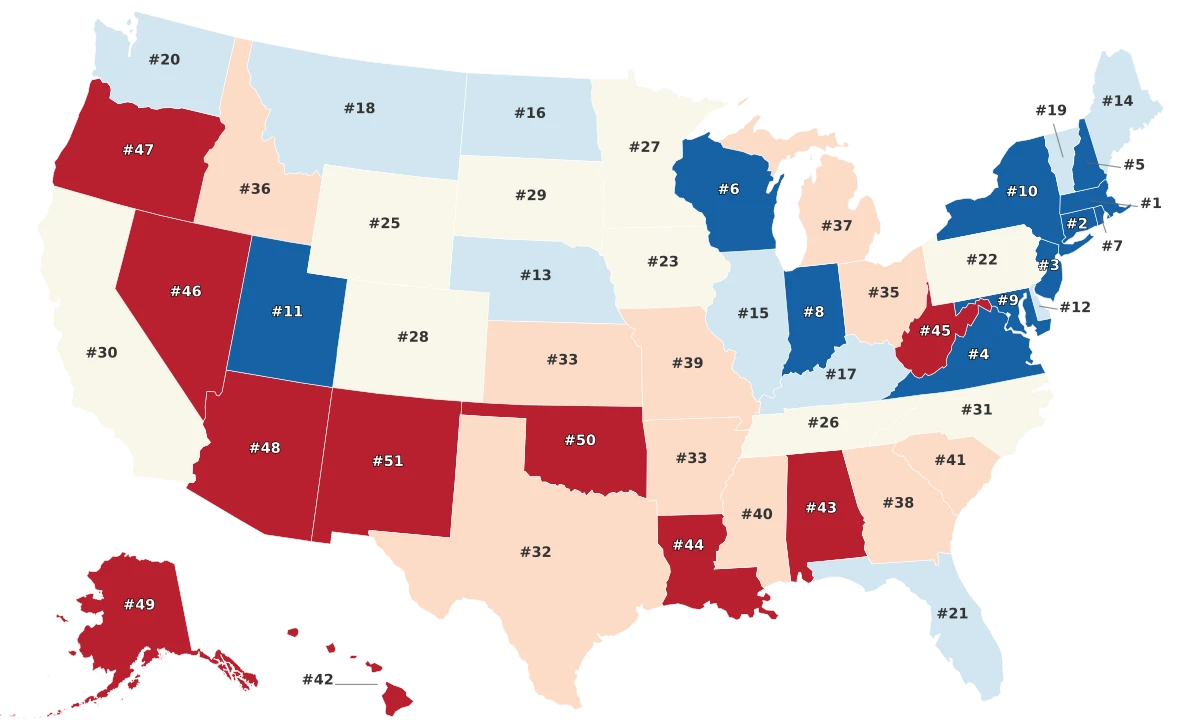
West Virginia Spends More Per Student Than 25 States and Still Finishes Last
People searching for the "dumbest" states expect an intelligence ranking, but what this data actually measures is education. Every state here is scored on a scale of 0 to 100 using WalletHub's 2025 Education Score, a composite of 18 metrics across two dimensions: educational attainment (the share of adults with college and graduate degrees) and education quality (test scores, graduation rates, AP exam performance, and equity gaps). The score captures how well a state's schools perform and how educated its adult population is.
Massachusetts leads the country at 82.3, more than 7 points clear of second-place Maryland at 75.1. That gap is the widest between any two consecutive states in the ranking. At the other end, West Virginia finishes last at 24.3, nearly 28 points below the national average. The distance between first and last place is 58 points.
The West Virginia result is striking because the state is not starving its schools. Per-pupil spending ranks 25th nationally, ahead of Texas, Florida, and Arizona. But money cannot fix what happens outside the classroom. According to West Virginia Watch, the state has one of the highest childhood poverty rates in the country, 35% of its students were chronically absent in the 2021-22 school year, and many schools lack full-time counselors.
Massachusetts took a different path. The state's 1993 Education Reform Act established rigorous curriculum standards, the MCAS assessment, and targeted funding for disadvantaged districts. Thirty years later, Massachusetts leads NAEP scores in all four assessment categories, and more than five out of six of its K-12 teachers hold advanced degrees. The gap between these two states is not about money: it is about what three decades of sustained policy investment look like versus three decades without it.
Nine of the Bottom Twelve States Are in the South
The regional divide in this ranking is enormous. The Northeast averages 65.18 on the Education Score while the South averages 44.98, a gap of more than 20 points. The Midwest and West both sit near the national mean. In this ranking, geography is destiny.
The bottom of the ranking reads like a map of the old Confederacy and its neighbors. West Virginia, Louisiana, and Arkansas anchor the very bottom, with Oklahoma, Kentucky, Alabama, and New Mexico just above them. Nine of the twelve lowest-scoring states are in the South. The three exceptions are Nevada, Idaho, and Indiana.
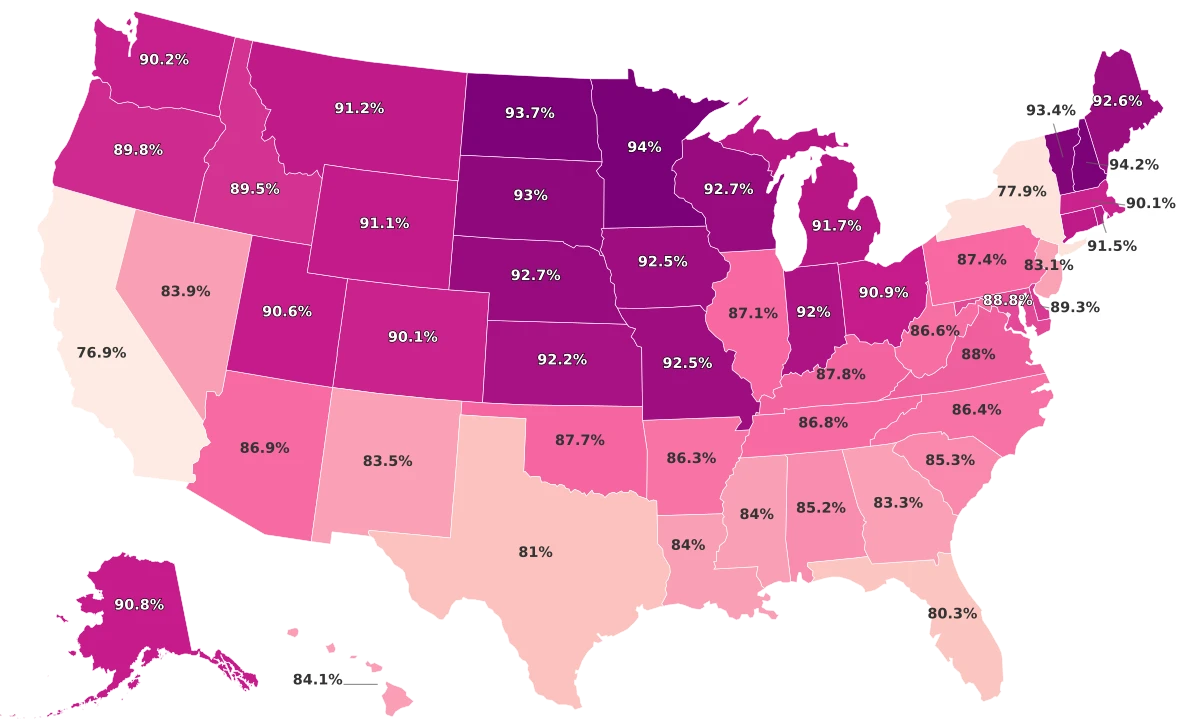
States That Graduate More Students Also Score Higher on IQ Tests
High school completion and average IQ track closely across all 50 states, reinforcing that both metrics reflect educational access more than innate ability.
The pattern holds across every metric in the dataset. Southern states average 87.88% on high school completion compared to 91.54% in the Midwest. On average IQ, the South sits at 98.42 versus 102.59 in the Northeast. The scatter plot above shows how tightly these two supporting metrics move together: states that finish more students through high school almost always score higher on IQ tests.
The structural causes behind the Southern cluster are well-documented: higher childhood poverty, less access to pre-K programs, lower teacher pay relative to cost of living, and rural isolation that makes it harder to recruit and retain qualified educators. These are not independent problems. They compound.
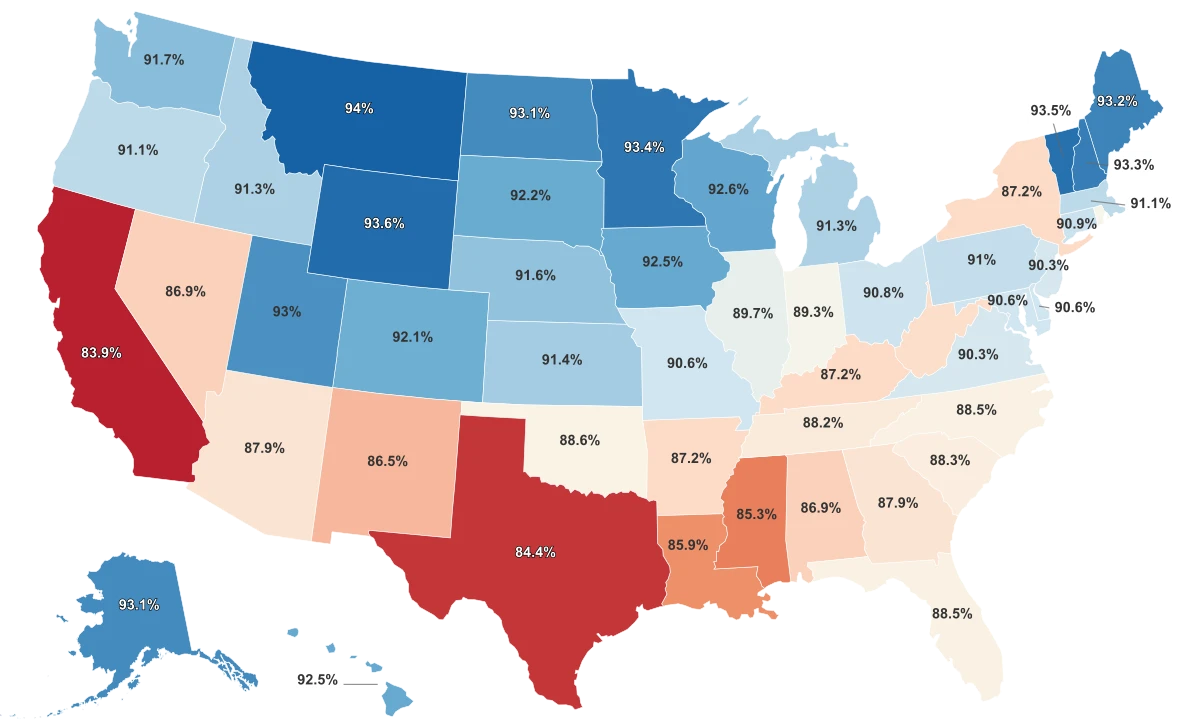
California Has the World's Fifth-Largest Economy and the Lowest High School Completion Rate
California has Silicon Valley, the University of California system, and a GDP larger than most countries. It also has the lowest high school completion rate in the dataset at 83.9%, trailing even Mississippi at 85.3%. Its average IQ estimate of 95.5 places it near the bottom of all 50 states. On Education Score, California lands at 49.5, right in the middle of the pack.
The explanation is linguistic, not cognitive. According to the California Department of Education, about 1 in 3 students in the state's K-12 system speak a non-English home language. Over one million are classified as current English Learners, and they take the same standardized tests used to estimate graduation rates and IQ in a language they are still acquiring.
Texas tells the same story. It has the second-largest English Learner population in the country and ranks 49th in high school completion at 84.4%. Research from the Public Policy Institute of California found that English Learners' poverty rates range from 74% to 85%, far above statewide averages. Both states are pulled down by metrics that penalize large immigrant populations taking academic assessments in a language they have not yet mastered.
Here is what the data does not capture: once English Learners are reclassified as fluent, they match or slightly exceed native English speakers on the same tests. The California data tracks current ELs, not the millions who have already transitioned. For these two states, the bottom-tier rankings say more about the scale of immigration than about the quality of education available to long-term residents.
Half This Score Comes from Who Moves In, Not Who Graduates
The WalletHub Education Score weights degree attainment heavily. Roughly 45% of the total score comes from the share of adults aged 25 and older with at least some college, a bachelor's degree, or a graduate degree. That means the ranking partly measures who lives in a state, not just how well the state educates the people who grow up there.
This distinction matters because educated adults are mobile. Colorado, Virginia, and Maryland all rank in the top ten for Education Score, and all three attract federal workers, tech employees, and professionals with advanced degrees. Their high scores partly reflect who moves in for work, not just classroom outcomes. States like West Virginia and Arkansas experience the reverse: young people who earn degrees leave for jobs elsewhere, pulling the attainment numbers down.
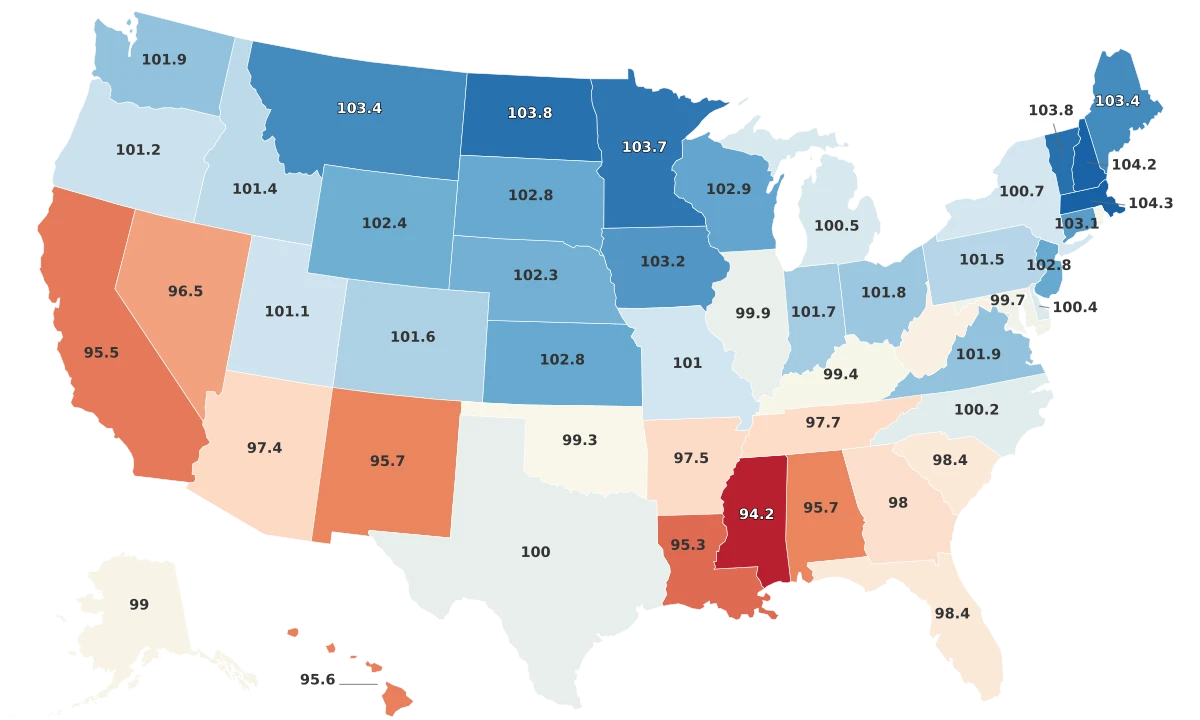
The supporting metrics carry their own caveats. The average IQ estimates come from a 2006 study by Michael McDaniel at Virginia Commonwealth University, which derived state-level scores from NAEP test results in public schools only, excluding private and homeschool students. Those scores measure crystallized academic knowledge, the kind built by schooling, not a fixed trait. A child who moves from a low-scoring state to a high-scoring one would likely see their results improve, not because they got smarter, but because they entered a better-funded system.
The ranking is still useful: states at the top consistently invest in teacher quality, fund disadvantaged districts, and build systems that retain educated residents. The states at the bottom face real, structural barriers that show up across every metric. But the label "dumbest" obscures more than it reveals. What this data actually maps is the combined effect of school funding, childhood poverty, migration patterns, and language diversity, not how intelligent people are in any given state.