Coffee Production by Country

Last updated February 28, 2026
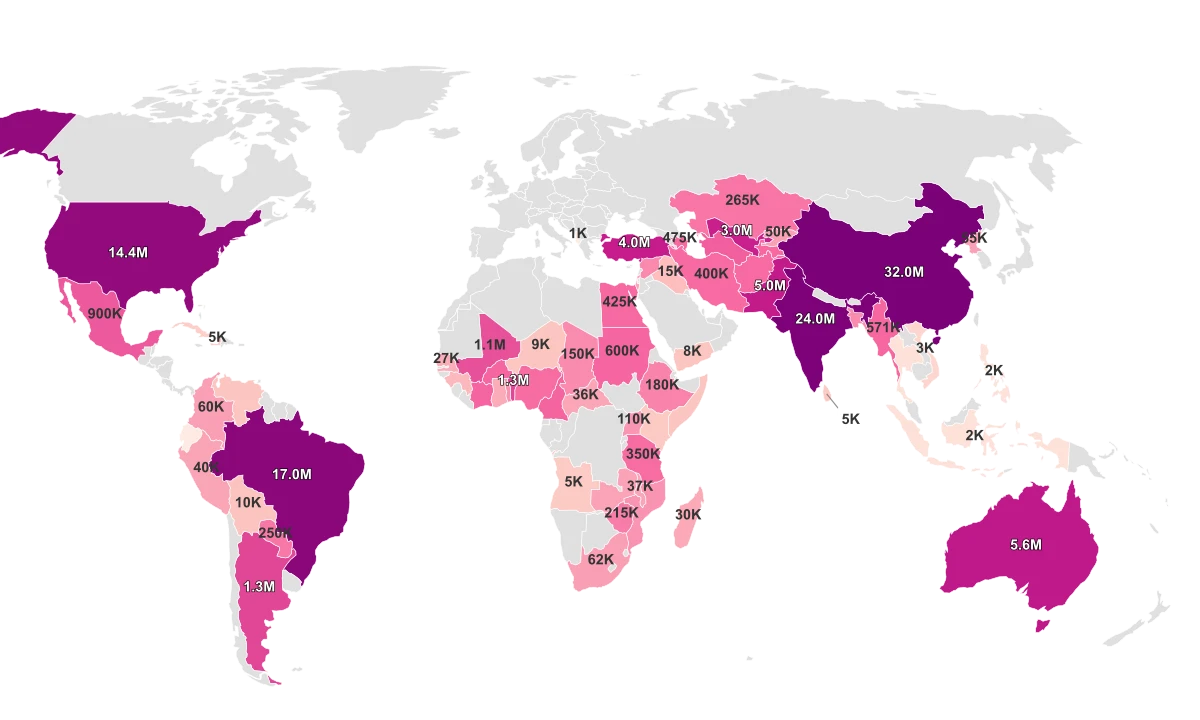
Global Coffee Production
As the aroma of a freshly brewed cup of coffee fills the air, one can't help but ponder where this invigorating beverage begins its journey. Coffee production, primarily in tropical regions, is a significant economic sector for many countries.
Key findings reveal:
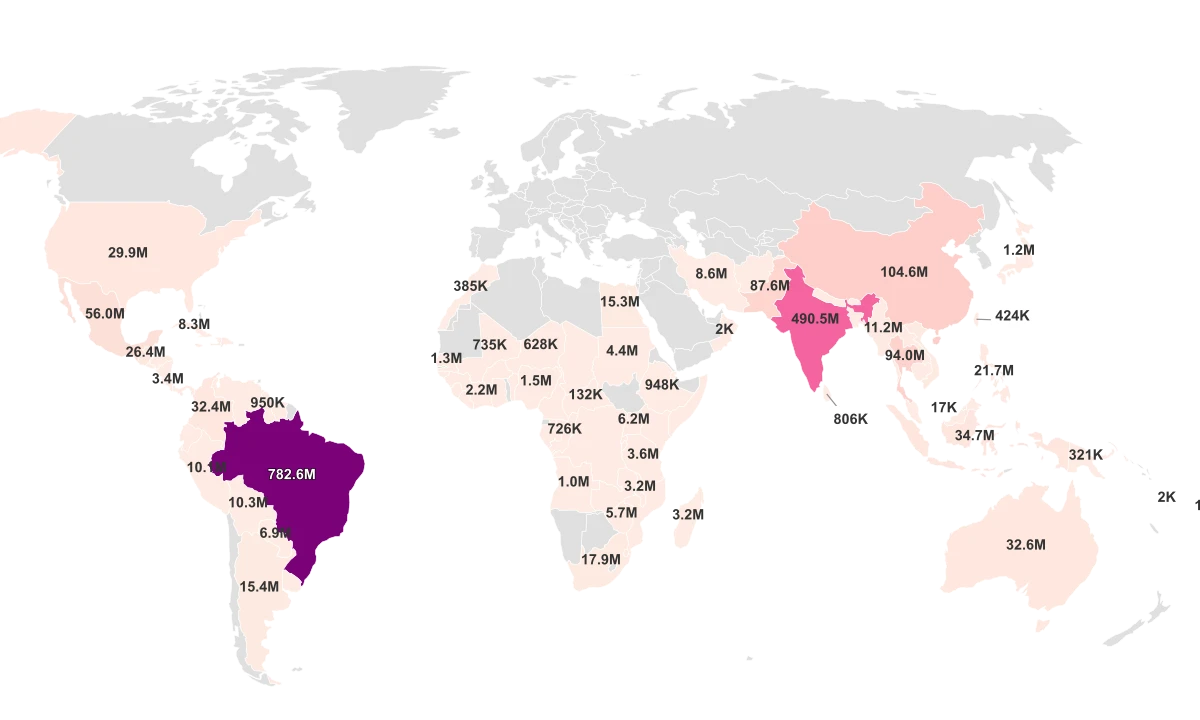
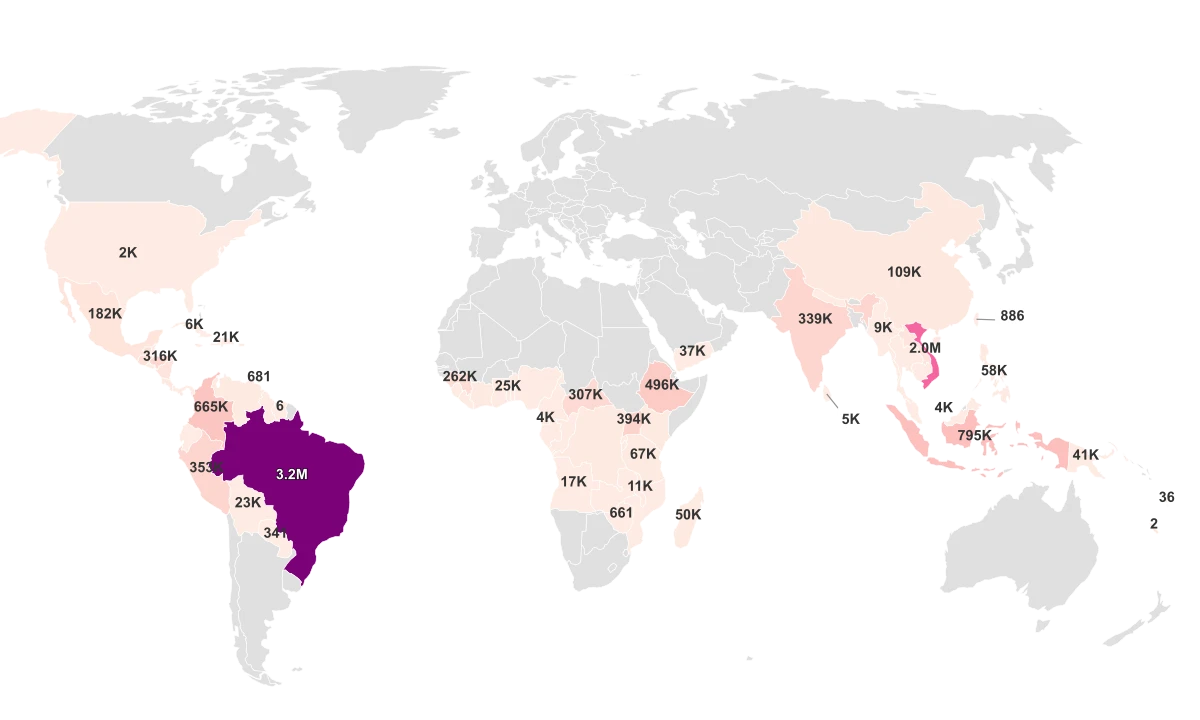
- As of 2022, Brazil leads global coffee production with a staggering 3 million tons produced annually, keeping its longstanding title as the world's top coffee producer.
- Vietnam, known primarily for its robusta coffee, holds second place, producing 1.7 million tons annually.
- Despite its high coffee consumption, the United States is not a major coffee producer. Its annual production is modest, at 2.3 thousand tons, mainly from the tropical state of Hawaii, known for its premium Kona coffee.
- Africa, known as the birthplace of coffee, has Ethiopia as its top producer, yielding 482.6 thousand tons annually, contributing significantly to the continent's overall coffee output.
- Colombia is the top South American producer after Brazil, producing 885.1 thousand tons annually. It is famous for its high-quality Arabica coffee.
All Metrics
| Region ↕ | Coffee Production 2022↕ | Coffee Production per Person 2019↕ | Coffee Consumption Rate 2022↕ | Coffee Area Harvested 2019↕ |
|---|---|---|---|---|
| Brazil | 3.2M | 14.36 | 2.2 | 1.8M |
| Vietnam | 2.0M | 17.79 | 3.4 | 622.6K |
| Indonesia | 794.8K | 2.87 | 0.2 | 1.3M |
| Colombia | 665.0K | 17.73 | 1.7 | 853.7K |
| Ethiopia | 496.2K | 4.49 | 1.6 | 758.5K |
| Uganda | 393.9K | 6.55 | 0.3 | 469.4K |
| Peru | 352.6K | 11.63 | 3.5 | 359.5K |
| India | 338.6K | 0.24 | 416.7K | |
| Honduras | 315.5K | 52.86 | 0.2 | 421.0K |
| Central African Republic | 306.9K | 2.14 | 52.1 | 48.8K |
| Guinea | 261.6K | 3.56 | 12.5 | 99.8K |
| Guatemala | 225.5K | 13.00 | 3.3 | 308.2K |
| Mexico | 181.7K | 1.33 | 0.3 | 629.3K |
| Laos | 171.0K | 23.83 | 20.2 | 87.8K |
| Nicaragua | 170.2K | 27.69 | 0.4 | 180.4K |
| China | 108.9K | 0.086 | 0.2 | 39.6K |
| Costa Rica | 79.2K | 16.81 | 5.2 | 93.7K |
| Ivory Coast | 70.0K | 2.72 | 0.1 | 954.0K |
| Tanzania | 67.2K | 0.95 | 0.1 | 170.5K |
| DR Congo | 58.8K | 0.38 | 0.5 | 79.4K |
| Philippines | 58.3K | 0.56 | 4.8 | 112.0K |
| Venezuela | 57.2K | 1.78 | 1.8 | 160.6K |
| Kenya | 51.9K | 0.87 | 0.0 | 116.2K |
| Madagascar | 50.3K | 2.50 | 1.7 | 112.5K |
| Papua New Guinea | 40.8K | 6.50 | 1.5 | 52.2K |
| Yemen | 36.5K | 0.72 | 1.1 | 35.0K |
| El Salvador | 30.7K | 5.96 | 3.1 | 160.0K |
| Cameroon | 26.4K | 1.18 | 0.5 | 89.9K |
| Togo | 25.1K | 2.90 | 1.9 | 42.7K |
| Bolivia | 23.2K | 2.20 | 2.0 | 25.5K |
| Dominican Republic | 20.6K | 1.49 | 2.9 | 75.3K |
| Rwanda | 18.9K | 2.45 | 0.1 | 21.8K |
| Thailand | 18.7K | 0.36 | 0.8 | 36.8K |
| Burundi | 17.2K | 1.32 | 0.3 | 15.4K |
| Angola | 16.8K | 0.58 | 0.6 | 55.2K |
| Timor Leste | 11.7K | 19.70 | 11.6 | 123.1K |
| Malawi | 11.0K | 0.62 | 0.5 | 5.1K |
| Myanmar | 8.9K | 0.16 | 0.5 | 12.8K |
| Zambia | 8.6K | 0.41 | 0.1 | 7.7K |
| Jamaica | 8.6K | 2.05 | 3.2 | 7.6K |
| Ecuador | 8.0K | 0.48 | 0.0 | 36.0K |
| Panama | 7.5K | 1.73 | 3.4 | 16.1K |
| Cuba | 6.3K | 0.48 | 0.8 | 16.6K |
| Haiti | 5.1K | 1.86 | 0.4 | 40.0K |
| Sri Lanka | 4.8K | 0.23 | 0.3 | 5.7K |
| Equatorial Guinea | 4.1K | 3.46 | 11.5K | |
| Malaysia | 3.8K | 0.11 | 1.6K | |
| Republic of the Congo | 3.1K | 0.57 | 0.7 | 10.1K |
| Sierra Leone | 2.6K | 2.50 | 0.1 | 9.4K |
| United States | 2.4K | 0.007 | 5.0 | 2.8K |
| Nigeria | 1.9K | 0.006 | 0.1 | 868 |
| Taiwan | 886 | 0.002 | 1.9 | 78 |
| Puerto Rico | 843 | |||
| Mozambique | 816 | 0.029 | 0.1 | 863 |
| Ghana | 736 | 0.020 | 0.0 | 349 |
| Trinidad and Tobago | 681 | 0.017 | 10.9 | 157 |
| Zimbabwe | 661 | 0.035 | 0.1 | 10.9K |
| Liberia | 654 | 0.12 | 0.6 | 2.2K |
| Guyana | 600 | 0.55 | 11.1 | 566 |
| Cambodia | 374 | 0.024 | 0.7 | 480 |
| Dominica | 370 | 2.06 | 10.9 | 1.3K |
| Nepal | 355 | 0.022 | 0.1 | 2.9K |
| Paraguay | 341 | 0.057 | 0.7 | 310 |
| Saint Vincent and the Grenadines | 180 | 1.66 | 3.0 | 585 |
| Comoros | 141 | 0.17 | 0.5 | 1.1K |
| Gabon | 104 | 0.042 | 1.0 | 251 |
| Belize | 90 | 0.22 | 25.5 | 121 |
| Benin | 55 | 0.004 | 0.3 | 221 |
| Cape Verde | 47 | 0.064 | 3.0 | 158 |
| Vanuatu | 36 | 0.10 | 4.7 | 50 |
| French Polynesia | 21 | 9.3 | ||
| Tonga | 15 | 0.16 | 1.3 | 11 |
| Fiji | 14 | 0.009 | 12.7 | 14 |
| Samoa | 12 | 0.060 | 12.2 | 40 |
| Sao Tome and Principe | 8 | 0.035 | 0.3 | 176 |
| Suriname | 6 | 0.011 | 6.4 | 225 |
| New Caledonia | 2 | 11.8 | ||
| Cook Islands | 0 |
Biggest Producers of Coffee
The top ten countries with the highest coffee production are Brazil, Vietnam, Colombia, Indonesia, Ethiopia, Honduras, Peru, India, Uganda, and Guatemala. Leading the pack is Brazil, producing a whopping 3.0 million tons of coffee each year. Vietnam takes the second place with 1.7 million tons of annual coffee production. Colombia is at third place with 885.1 thousand tons annually, followed by Indonesia, which produces 761.0 thousand tons per annum. Ethiopia is the fifth-largest coffee-producing country producing 482.6 thousand tons followed closely by Honduras at 476.3 thousand tons. Peru and India also demonstrate significant coffee production output with 363.3 thousand tons and 319.5 thousand tons annually, respectively. Rounding off the top ten are Uganda and Guatemala, contributing 254.1 thousand tons and 225.0 thousand tons to global coffee production each year, respectively. 10 Countries with the Highest Coffee Production: 1. Brazil - 3.0M Tons 2. Vietnam - 1.7M Tons 3. Colombia - 885.1k Tons 4. Indonesia - 761.0k Tons 5. Ethiopia - 482.6k Tons 6. Honduras - 476.3k Tons 7. Peru - 363.3k Tons 8. India - 319.5k Tons 9. Uganda - 254.1k Tons 10. Guatemala - 225.0k Tons
Sources & Notes
Total annual production of coffee by country.
Coffee production quantity divided by the population of the country.
Total area used for coffee cultivation in Hectares.
Annual coffee consumption in kilograms per capita.


