Last updated May 24, 2025

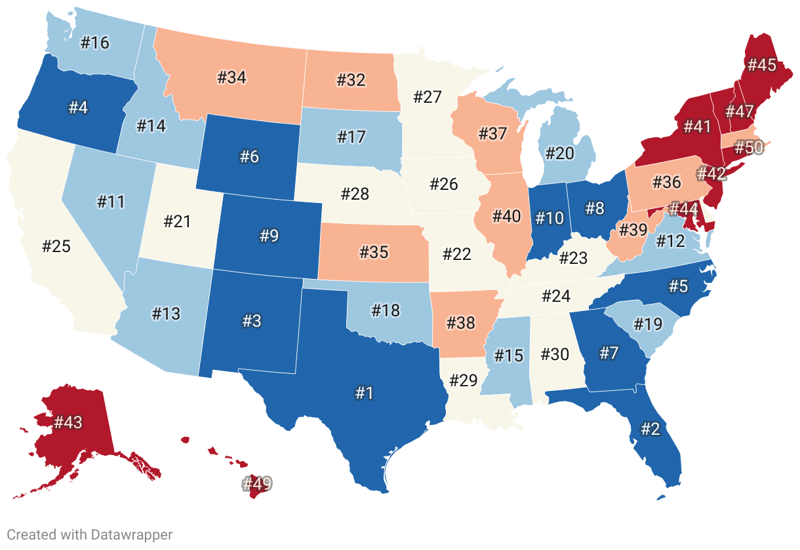
| 1 | North Dakota | 7.5 | |
| 2 | Kansas | 7.3 | |
| 3 | Wyoming | 7.1 | |
| 4 | Texas | 7 | |
| 5 | Oklahoma | 6.8 | |
| 6 | Alaska | 6.7 | |
| 7 | Nevada | 6.6 | |
| 7 | Massachusetts | 6.6 | |
| 9 | Washington | 6.5 | |
| 10 | Utah | 6.4 | |
| 10 | Tennessee | 6.4 | |
| 10 | Oregon | 6.4 | |
| 10 | Arkansas | 6.4 | |
| 10 | West Virginia | 6.4 | |
| 10 | New Hampshire | 6.4 | |
| 16 | Maine | 6.3 | |
| 16 | Pennsylvania | 6.3 | |
| 16 | Vermont | 6.3 | |
| 19 | Missouri | 6.2 | |
| 19 | Alabama | 6.2 | |
| 19 | North Carolina | 6.2 | |
| 19 | Ohio | 6.2 | |
| 19 | Wisconsin | 6.2 | |
| 24 | Delaware | 6.1 | |
| 24 | New York | 6.1 | |
| 24 | Indiana | 6.1 | |
| 24 | Minnesota | 6.1 | |
| 24 | Kentucky | 6.1 | |
| 24 | Georgia | 6.1 | |
| 30 | Colorado | 6 | |
| 30 | New Mexico | 6 | |
| 32 | Florida | 5.9 | |
| 32 | Iowa | 5.9 | |
| 32 | Idaho | 5.9 | |
| 35 | Connecticut | 5.8 | |
| 36 | New Jersey | 5.7 | |
| 36 | Virginia | 5.7 | |
| 36 | Arizona | 5.7 | |
| 36 | Illinois | 5.7 | |
| 36 | Michigan | 5.7 | |
| 41 | Nebraska | 5.6 | |
| 41 | South Dakota | 5.6 | |
| 43 | Louisiana | 5.5 | |
| 43 | Montana | 5.5 | |
| 43 | Rhode Island | 5.5 | |
| 46 | South Carolina | 5.4 | |
| 47 | Hawaii | 5.3 | |
| 47 | Mississippi | 5.3 | |
| 49 | Maryland | 5.2 | |
| 50 | California | 4.5 |
Living standards vary greatly across the United States, shaped by factors such as the economy, opportunities, quality of education, healthcare, environment, lifestyle and safety. Many factors can influence an individual's perception of a state's livability, which can be subjective and contingent on personal preferences and circumstances. However, a more objective perspective can be attained by assessing various public data points. The Livability Index quantifies these facets into a numerical score out of 100, allowing for direct comparisons between states. This measure is particularly useful for those considering relocation or simply curious about how their home state compares to the rest of the nation. Key findings from the data include: - New Hampshire topped the list with the highest Livability Index score of 66.6, boosted by strong performances in safety, education, environment, and overall living conditions. - North Dakota and Vermont also scored highly, both with a Livability Index Score of 64.2 and 64.1 respectively, showcasing strengths in their own domains across education, healthcare and lifestyle. - At the other end of the spectrum, New Mexico has the lowest Livability Index Score at 50.2, indicating a need for improvements across multiple areas including crime, education, and lifestyle conditions. - States like Connecticut (63.6) and Maine (63.3) exhibited high scores due to their strong education systems, robust economies, and favorable living conditions. - Meanwhile, states like Mississippi (51) and Louisiana (50.7) have low Livability Index scores, reflecting challenges in areas like economy and access to healthcare and education.
| Region ↕ | Economy Index↕ | Education Index↕ | Environment Index↕ | Health & Healthcare Index↕ | Infrastructure Index↕ | Job Opportunity Index↕ | Lifestyle Index↕ | Livability Index Score↕ | Safety and Crime Index↕ |
|---|---|---|---|---|---|---|---|---|---|
| North Dakota | 7.5 | 6.6 | 4.2 | 9.5 | 8 | 11.1 | 6.9 | 64.2 | 10.3 |
| Kansas | 7.3 | 6 | 4.2 | 8.5 | 8 | 10.7 | 3.9 | 58 | 9.4 |
| Wyoming | 7.1 | 6.4 | 5.1 | 9.5 | 8 | 10.9 | 4.8 | 64 | 12.3 |
| Texas | 7 | 5.4 | 3.5 | 7.6 | 7.7 | 10.2 | 2.9 | 55.8 | 11.6 |
| Oklahoma | 6.8 | 5.1 | 4.6 | 7.7 | 7.3 | 10.5 | 3.3 | 55.6 | 10.3 |
| Alaska | 6.7 | 5.8 | 8.7 | 11.6 | 6.6 | 9.4 | 4.8 | 62.6 | 9 |
| Nevada | 6.6 | 4.4 | 4.7 | 7.6 | 8.4 | 8.5 | 3.9 | 53.1 | 9 |
| Massachusetts | 6.6 | 8.4 | 5.8 | 12 | 6.7 | 9.7 | 4 | 63.3 | 10.3 |
| Washington | 6.5 | 7.2 | 6.1 | 10.6 | 8.1 | 9.8 | 3.8 | 59 | 6.9 |
| Utah | 6.4 | 6 | 4.6 | 9.1 | 8.7 | 9.9 | 3 | 58.8 | 10.9 |
| Tennessee | 6.4 | 5.6 | 5.5 | 7.8 | 8.1 | 10.3 | 2.9 | 54.8 | 8.3 |
| Oregon | 6.4 | 6.2 | 5.6 | 10.9 | 7.8 | 8.8 | 4.5 | 59.7 | 9.6 |
| Arkansas | 6.4 | 5.4 | 5.4 | 7.2 | 7.6 | 10 | 2.5 | 52.6 | 8.1 |
| West Virginia | 6.4 | 5.5 | 6.1 | 7.4 | 4.2 | 10 | 2.6 | 54.1 | 12.1 |
| New Hampshire | 6.4 | 8 | 6.3 | 10.6 | 8.1 | 10 | 4 | 66.6 | 13.2 |
| Maine | 6.3 | 7.5 | 6.3 | 10 | 6.9 | 9.9 | 4.6 | 63.3 | 11.9 |
| Pennsylvania | 6.3 | 7.1 | 5.2 | 9.1 | 6.6 | 10.5 | 3.8 | 58.8 | 10.2 |
| Vermont | 6.3 | 7.3 | 6.2 | 10.8 | 7.8 | 9.8 | 4.9 | 64.1 | 11 |
| Missouri | 6.2 | 6.3 | 5 | 7.9 | 7.4 | 10.5 | 3.7 | 56.2 | 9.2 |
| Alabama | 6.2 | 4.9 | 5.4 | 6.8 | 8.2 | 10.5 | 2.4 | 54.2 | 9.9 |
| North Carolina | 6.2 | 5.7 | 5.5 | 8.3 | 7.8 | 10.2 | 3.3 | 57 | 10 |
| Ohio | 6.2 | 5.8 | 4.5 | 8.5 | 7.8 | 10.5 | 3.5 | 55.9 | 9.2 |
| Wisconsin | 6.2 | 6.5 | 5.1 | 9.1 | 6.4 | 10.5 | 4.7 | 59.4 | 10.9 |
| Delaware | 6.1 | 7.3 | 4.9 | 8.8 | 8.7 | 9.9 | 3.8 | 58.9 | 9.4 |
| New York | 6.1 | 7.1 | 5.9 | 10.2 | 6.1 | 9.5 | 4.2 | 60 | 10.9 |
| Indiana | 6.1 | 6.4 | 4.5 | 8.1 | 8.1 | 10.3 | 3.4 | 57.9 | 11 |
| Minnesota | 6.1 | 6.9 | 5.3 | 10.4 | 8 | 11.3 | 4.2 | 62.9 | 10.8 |
| Kentucky | 6.1 | 5.4 | 5.1 | 8.1 | 8 | 9.9 | 2.5 | 56 | 10.9 |
| Georgia | 6.1 | 6.2 | 5.5 | 7.5 | 8.1 | 10.2 | 2.9 | 56.8 | 10.4 |
| Colorado | 6 | 6.7 | 4.9 | 10.2 | 7.6 | 10 | 4.1 | 58.6 | 9.1 |
| New Mexico | 6 | 5 | 4.9 | 9.4 | 7.1 | 9.8 | 2.9 | 50.2 | 5.1 |
| Florida | 5.9 | 5.4 | 5.6 | 8.6 | 8.3 | 9.8 | 3.6 | 57.5 | 10.4 |
| Iowa | 5.9 | 6.9 | 4.4 | 8.6 | 6.4 | 10.5 | 5.3 | 59.7 | 11.8 |
| Idaho | 5.9 | 6.4 | 5.6 | 9.2 | 7.3 | 9.4 | 3.7 | 58.9 | 11.4 |
| Connecticut | 5.8 | 7.9 | 5.4 | 10.8 | 8.2 | 10.3 | 3.7 | 63.6 | 11.4 |
| New Jersey | 5.7 | 7.5 | 5.7 | 9.1 | 5.7 | 8.9 | 3.3 | 56.8 | 10.7 |
| Virginia | 5.7 | 7.4 | 5.6 | 9 | 7.8 | 11 | 3.2 | 60.5 | 10.9 |
| Arizona | 5.7 | 4.6 | 4.5 | 8.5 | 8 | 9.6 | 3.1 | 52.8 | 8.9 |
| Illinois | 5.7 | 6.9 | 4.1 | 9.1 | 6.7 | 10.7 | 3.8 | 56.7 | 9.6 |
| Michigan | 5.7 | 6.8 | 5.3 | 9.7 | 6.8 | 10.5 | 3.3 | 58 | 10 |
| Nebraska | 5.6 | 6.5 | 4.6 | 9.5 | 7.4 | 10.5 | 4.6 | 60.3 | 11.5 |
| South Dakota | 5.6 | 6.6 | 4.5 | 9.4 | 7.4 | 10.4 | 6.7 | 60.9 | 10.3 |
| Louisiana | 5.5 | 4.8 | 5.2 | 7.2 | 6.1 | 10.4 | 3.3 | 50.7 | 8.3 |
| Montana | 5.5 | 6.4 | 5.2 | 9.8 | 7.4 | 9.3 | 6.3 | 59.7 | 9.6 |
| Rhode Island | 5.5 | 7.2 | 5.8 | 10.4 | 6 | 9.7 | 4.1 | 60 | 11.3 |
| South Carolina | 5.4 | 5.4 | 5.5 | 7.7 | 8.3 | 10.4 | 3.1 | 53.8 | 8 |
| Hawaii | 5.3 | 5.9 | 6.7 | 10.8 | 7 | 6.5 | 3.4 | 55.3 | 9.7 |
| Mississippi | 5.3 | 4.8 | 5.6 | 7 | 6.4 | 9.9 | 2.3 | 51 | 9.7 |
| Maryland | 5.2 | 7.4 | 5.1 | 9.3 | 7.9 | 10.7 | 3.2 | 58 | 9.3 |
| California | 4.5 | 6 | 4.8 | 10.1 | 6.3 | 7.9 | 3.7 | 53.8 | 10.6 |
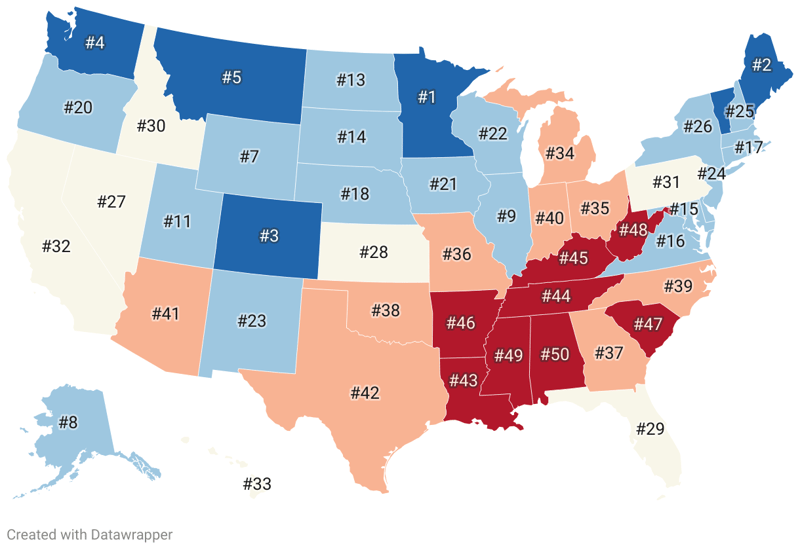
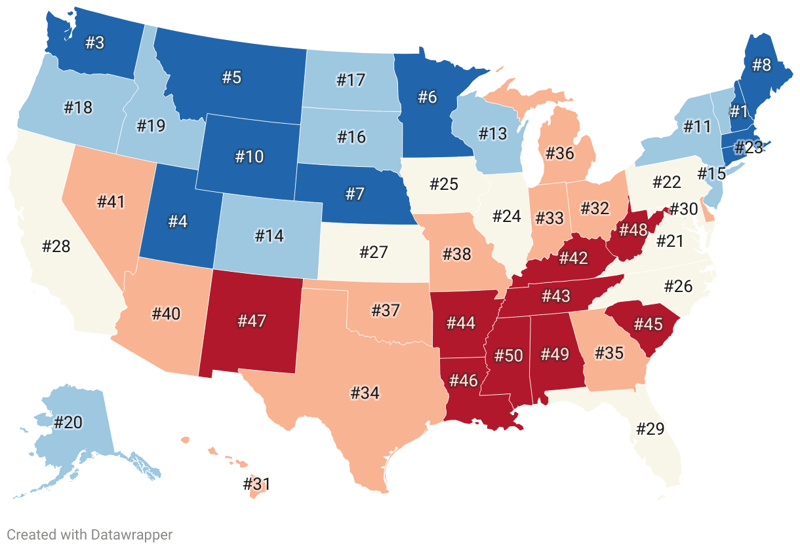
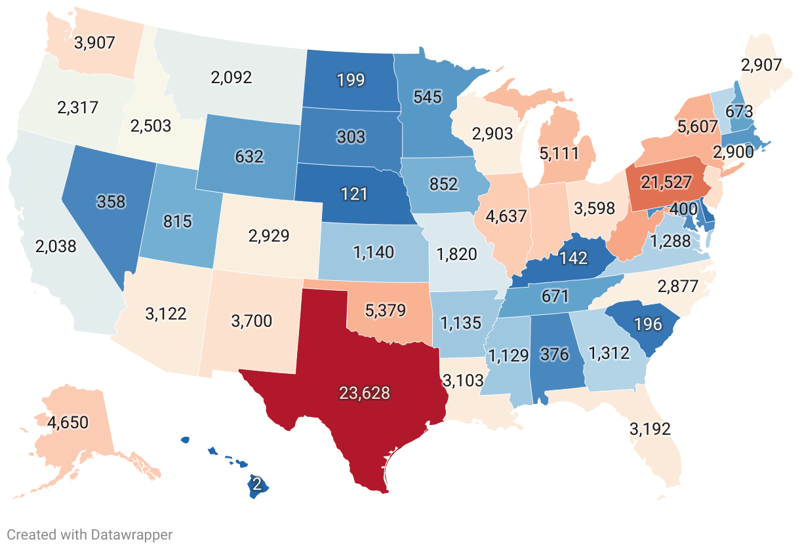
To determine the best states to live in the 50 states were compared across 8 key categories: