Best Tap Water in the U.S.

Last updated May 23, 2025

Number of Water Quality Violations
Average Water Bill
Top
Last
Number of Water Quality ViolationsQuestion Mark
1.TexasTexas23,628
2.PennsylvaniaPennsylvania21,527
3.West VirginiaWest Virginia8,490
4.New YorkNew York5,607
5.OklahomaOklahoma5,379
6.MichiganMichigan5,111
7.AlaskaAlaska4,650
8.IllinoisIllinois4,637
9.IndianaIndiana4,612
10.WashingtonWashington3,907
11.New JerseyNew Jersey3,815
12.New MexicoNew Mexico3,700
13.OhioOhio3,598
14.FloridaFlorida3,192
15.ArizonaArizona3,122
16.LouisianaLouisiana3,103
17.ColoradoColorado2,929
18.MaineMaine2,907
19.WisconsinWisconsin2,903
20.ConnecticutConnecticut2,900
21.North CarolinaNorth Carolina2,877
22.IdahoIdaho2,503
23.OregonOregon2,317
24.MontanaMontana2,092
25.CaliforniaCalifornia2,038
26.MissouriMissouri1,820
27.VermontVermont1,376
28.GeorgiaGeorgia1,312
29.VirginiaVirginia1,288
30.KansasKansas1,140
31.ArkansasArkansas1,135
32.MississippiMississippi1,129
33.IowaIowa852
34.UtahUtah815
35.New HampshireNew Hampshire673
36.TennesseeTennessee671
37.WyomingWyoming632
38.MassachusettsMassachusetts545
38.MinnesotaMinnesota545
40.MarylandMaryland400
41.AlabamaAlabama376
42.NevadaNevada358
43.South DakotaSouth Dakota303
44.Rhode IslandRhode Island243
45.North DakotaNorth Dakota199
46.South CarolinaSouth Carolina196
47.KentuckyKentucky142
48.DelawareDelaware131
49.NebraskaNebraska121
50.HawaiiHawaii2

Introduction

In all corners of America, from Alaska's glacial rivers to Florida's tropical springs, the quality of tap water is a testament to the natural resources, infrastructure, and regulatory fortitude of each state. With over 50,000 community water systems in the U.S, the quality of tap water can drastically vary, making it an intricate part of our everyday lives and health. According to the most recent water quality violation data, there is a wide range in the commitment and success by states in maintaining compliance with federal water standards.

Our analysis relies on the water quality violations metric, which catalogues the instances when tap water quality fails to meet federal guidelines in a state. Fewer violations commonly indicate a more robust drinking water sector and cleaner tap water. Still, it's necessary to remember that these figures are statewide totals and might not reflect the specific conditions in individual cities or communities.

Key findings:

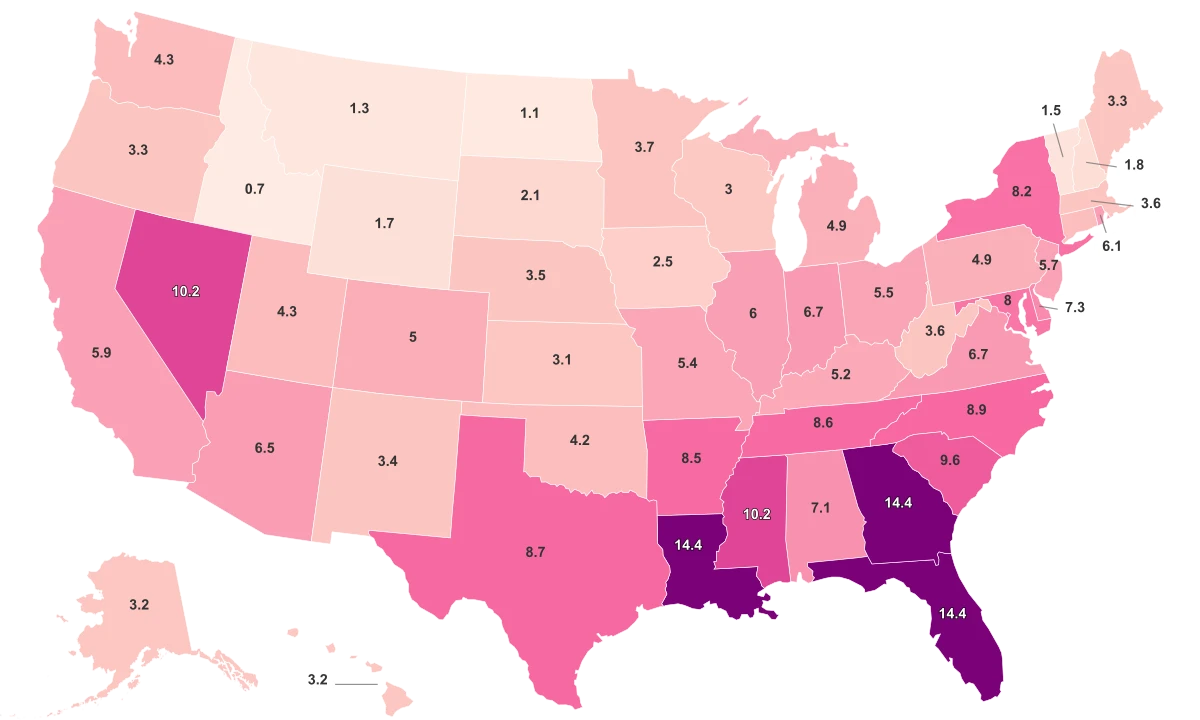
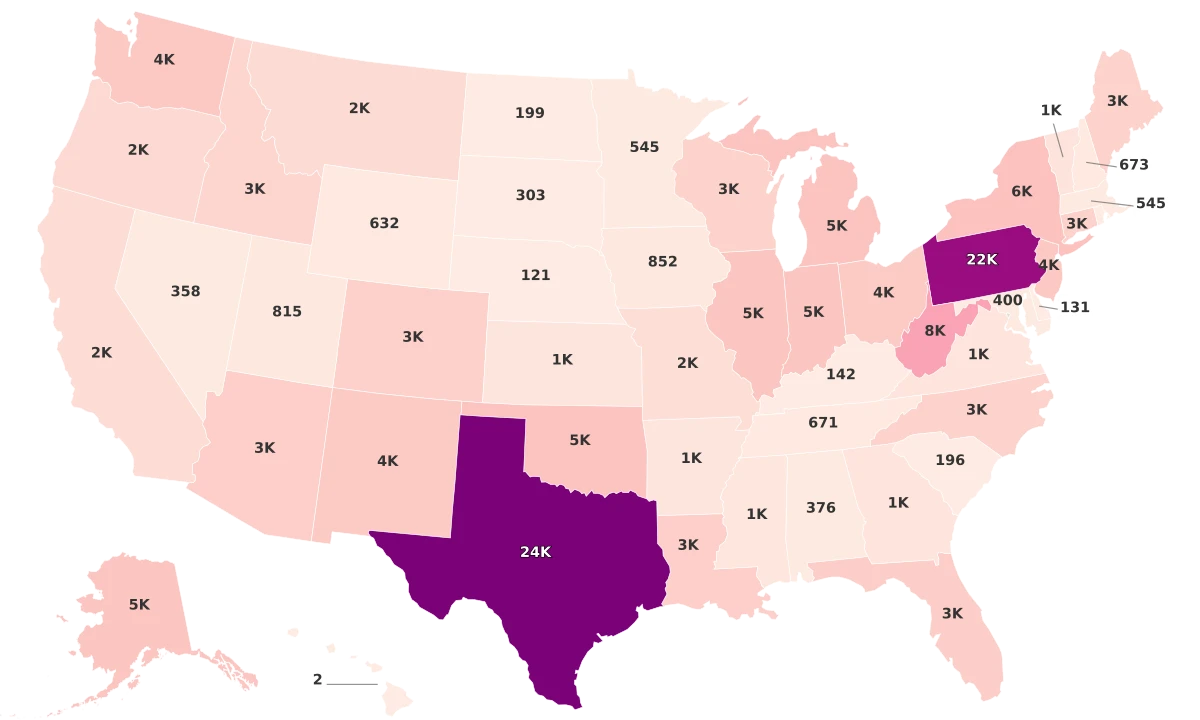
  • Hawaii shines as the U.S state with the best tap water, recording a mere two water quality violations. This is a remarkable achievement given the standard of federal water quality regulations.
  • The two subsequent top-performers are Nebraska and Delaware, with 121 and 131 violations respectively.
  • An alarming trend emerges as we analyze states at the other end of the spectrum. Texas (23,628 violations), Pennsylvania (21,527 violations) and West Virginia (8,490 violations), are struggling significantly with maintaining clean tap water.
  • Overall, a strong geographical trend doesn't leap out from the data, with top performers spread across the country, from the islands of Hawaii to the heartlands of Nebraska.

Best Tap Water in the U.S.

Region ↕# of Water Quality Violations↕Average Water Bill↕
Nebraska iconNebraska121$23
Delaware iconDelaware131$46
Kentucky iconKentucky142$49
South Carolina iconSouth Carolina196$33
North Dakota iconNorth Dakota199$31
Rhode Island iconRhode Island243$32
South Dakota iconSouth Dakota303$26
Nevada iconNevada358$26
Alabama iconAlabama376$30
Maryland iconMaryland400$46
Massachusetts iconMassachusetts545$34
Minnesota iconMinnesota545$28
Wyoming iconWyoming632$53
Tennessee iconTennessee671$43
New Hampshire iconNew Hampshire673$27
Utah iconUtah815$38
Iowa iconIowa852$32
Mississippi iconMississippi1,129$23
Arkansas iconArkansas1,135$26
Kansas iconKansas1,140$27
Virginia iconVirginia1,288$36
Georgia iconGeorgia1,312$28
Vermont iconVermont1,376$18
Missouri iconMissouri1,820$39
Montana iconMontana2,092$38
Oregon iconOregon2,317$76
Idaho iconIdaho2,503$38
North Carolina iconNorth Carolina2,877$20
Connecticut iconConnecticut2,900$69
Wisconsin iconWisconsin2,903$18
Maine iconMaine2,907$24
Louisiana iconLouisiana3,103$21
Arizona iconArizona3,122$64
Florida iconFlorida3,192$33
Ohio iconOhio3,598$27
New Mexico iconNew Mexico3,700$32
New Jersey iconNew Jersey3,815$72
Washington iconWashington3,907$75
Indiana iconIndiana4,612$30
Illinois iconIllinois4,637$26
Alaska iconAlaska4,650$68
Michigan iconMichigan5,111$29
Oklahoma iconOklahoma5,379$35
New York iconNew York5,607$30
West Virginia iconWest Virginia8,490$91
Pennsylvania iconPennsylvania21,527$31
Texas iconTexas23,628$37
Hawaii iconHawaii2$64
California iconCalifornia2,038$77
Colorado iconColorado2,929$39

States with the Best Tap Water

The state with the the best tap water in the United States is none other than the tropical paradise, Hawaii. Boasting a remarkably low number of two water quality violations, Hawaii demonstrates exceptional commitment to maintaining pure and safe water sources.

Following in Hawaii's footsteps are several states where efforts to ensure clean tap water do not go unnoticed. Nebraska and Delaware, with 121 and 131 water quality violations respectively, take the second and third place. The fourth spot goes to Kentucky with 142 water quality violations, and South Carolina follows close with 196 violations. North Dakota, Rhode Island, South Dakota, Nevada, and Alabama complete the top ten, with water quality violations ranging from 199 to 376. These states, despite their geographic diversity, share a common success in providing relatively safe and clean tap water to their residents.

States with the Best Tap Water (Number of Violations):

  1. Hawaii - 2
  2. Nebraska - 121
  3. Delaware - 131
  4. Kentucky - 142
  5. South Carolina - 196
  6. North Dakota - 199
  7. Rhode Island - 243
  8. South Dakota - 303
  9. Nevada - 358
  10. Alabama - 376
Keep reading

Additional Health Datasets

Cancer Rates By Country
Health
Country

Cancer Rates By Country

Circumcision By Country
Health
Country

Circumcision By Country

Circumcision Rate by State
Health
State

Circumcision Rate by State

Depression Rates By Country
Health
Country

Depression Rates By Country

HIV Rates By Country
Health
Country

HIV Rates By Country

HIV Rates By State
Health
State

HIV Rates By State