Introduction
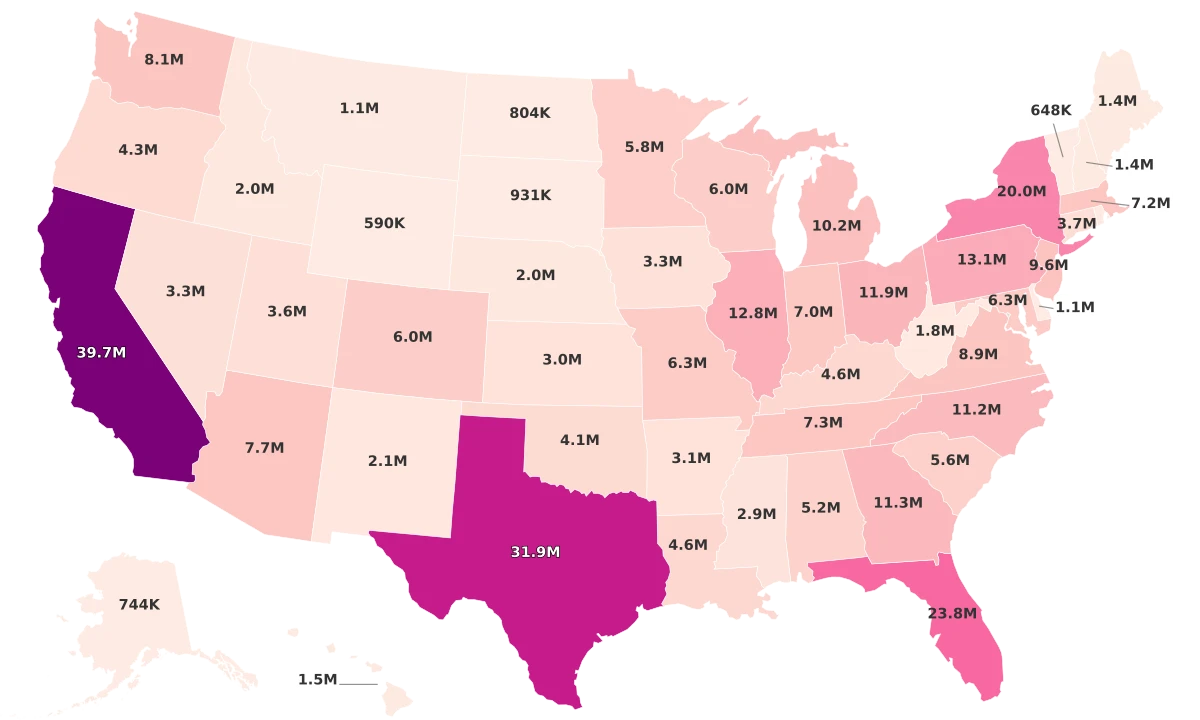
America's Black population has seen exponential growth and diversification, from the early arrivals during the era of the transatlantic slave trade to the increasing waves of immigrants from Africa and the Caribbean since the 1980s. Currently, the U.S Census estimates that the Black or African American population comprises roughly 14.6% of the national total. This translates to approximately 47.8 million people, with the Black-only population accounting for 13.4%.
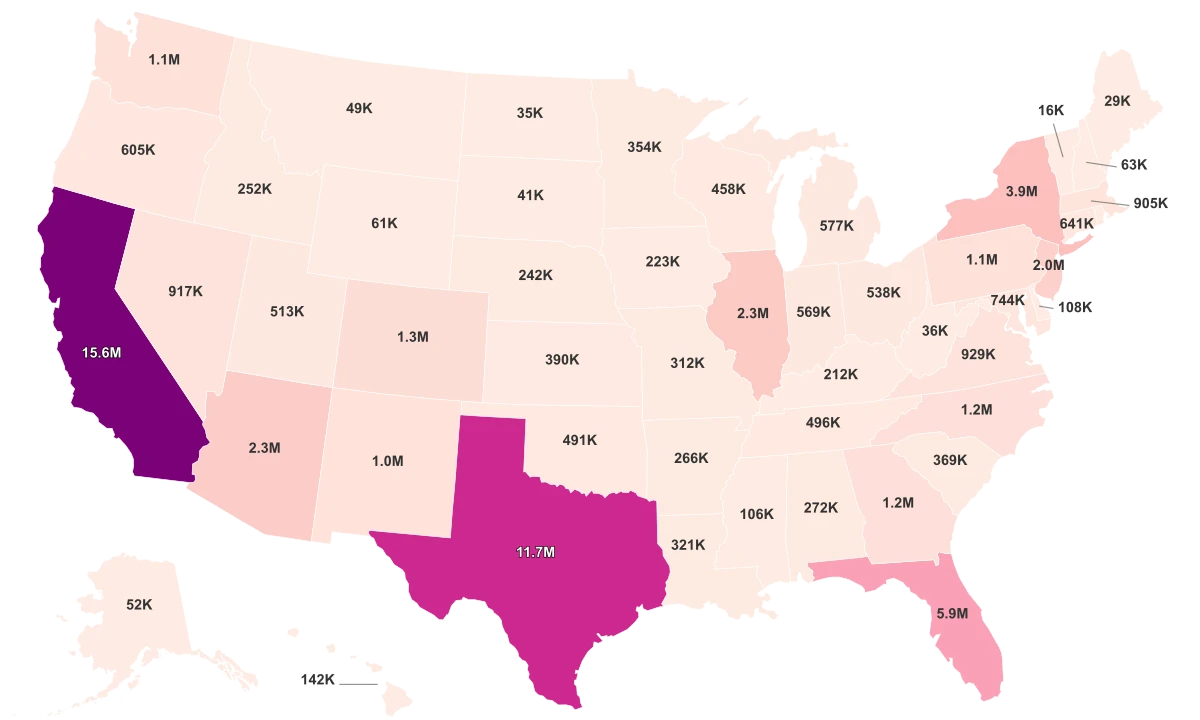
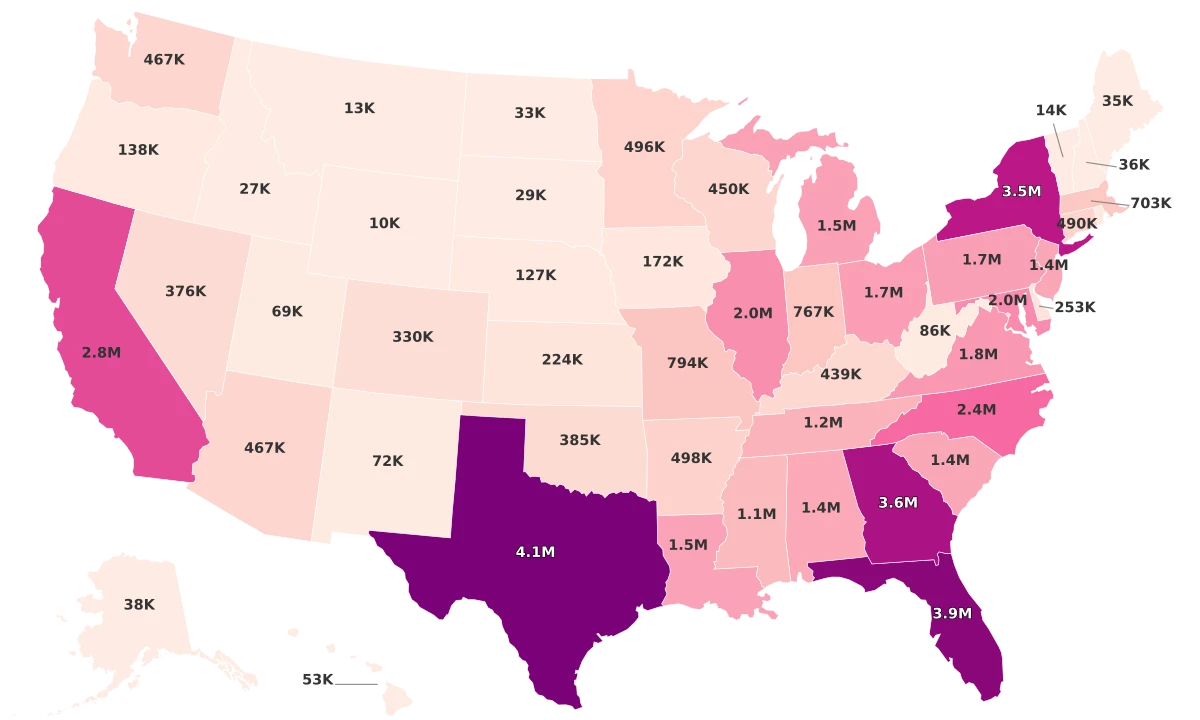
- Texas leads all other states with a Black population of around 3.6 million. This is followed closely by Georgia and Florida with 3.3 and 3.2 million individuals respectively. New York and California also boast significant Black populations, with approximately 3.0 and 2.2 million individuals respectively.
- By contrast, the states with the smallest Black populations tend to be those within the Rocky Mountain region and the northernmost parts of New England. States such as Wyoming and Montana both have Black populations of less than 10,000 residents.
- Moreover, the data reveals an intriguing concentration of the Black population in the Southern United States, a likely reflection of historical migration patterns.
- Meanwhile, states with large total populations, such as California and New York, also have significant Black populations. This suggests a correlation between the overall state population and the number of Black inhabitants.
States with Largest Black Population
Holding the lead with an impressive 3.6 million Black residents, Texas tops our list. Not too far behind is Georgia, with approximately 3.3 million Black inhabitants. Following suit is Florida, housing a black population of approximately 3.2 million.
New York comes fourth in the rank, showing a sizable number of around 3 million Black residents. Meanwhile, California, as one of the largest states in the U.S., hosts about 2.2 million Black residents. North Carolina stakes its claim at the sixth rank, with a Black population of nearly 2.1 million.
Further down the list, we see Maryland and Illinois each carrying around 1.8 million Black residents. Virginia presents a slightly smaller number, with a Black population of about 1.6 million. Lastly, representing the Midwest, Ohio makes it to the top ten with an approximate Black population of 1.5 million.
States with the Largest Black Population:
- Texas - 3.6M
- Georgia - 3.3M
- Florida - 3.2M
- New York - 3.0M
- California - 2.2M
- North Carolina - 2.1M
- Maryland - 1.8M
- Illinois - 1.8M
- Virginia - 1.6M
- Ohio - 1.5M
States with Least Black Population
Wyoming reports the least number of Black or African American residents, with just 5.2K individuals. This, however, does not come as a surprise when one takes into account Wyoming's overall population status, which is the smallest in the country. Montana follows suit, home to a slightly larger Black population with 5.5K individuals. Vermont, with its Black population comprising of roughly 9.0K individuals, also falls in line with Wyoming and Montana, featuring among the states with the smallest Black populations.
Idaho houses a slightly larger Black community than Wyoming and Montana, with approximately 15.7K Black or African American residents. South Dakota and New Hampshire also feature a Black population under 25K, with figures standing at approximately 17.8K and 20.1K respectively.
Alaska, Hawaii, and Maine have marginally larger Black communities ranging from 21.9K in Alaska to 25.8K in Maine. Finally, North Dakota rounds up the ten states with the smallest Black populations, hosting an estimated 26.8K Black or African American residents.
Least Black Populated States:
- Wyoming - 5.2K
- Montana - 5.5K
- Vermont - 9.0K
- Idaho - 15.7K
- South Dakota - 17.8K
- New Hampshire - 20.1K
- Alaska - 21.9K
- Hawaii - 23.4K
- Maine - 25.8K
- North Dakota - 26.8K