Most U.S. Beef Runs Through a Handful of States
This page uses the USDA's Livestock Slaughter 2024 Summary, which is the closest state-by-state production measure the agency publishes. It is not a census of every pound of boxed beef. It tracks where cattle were processed in commercial plants.
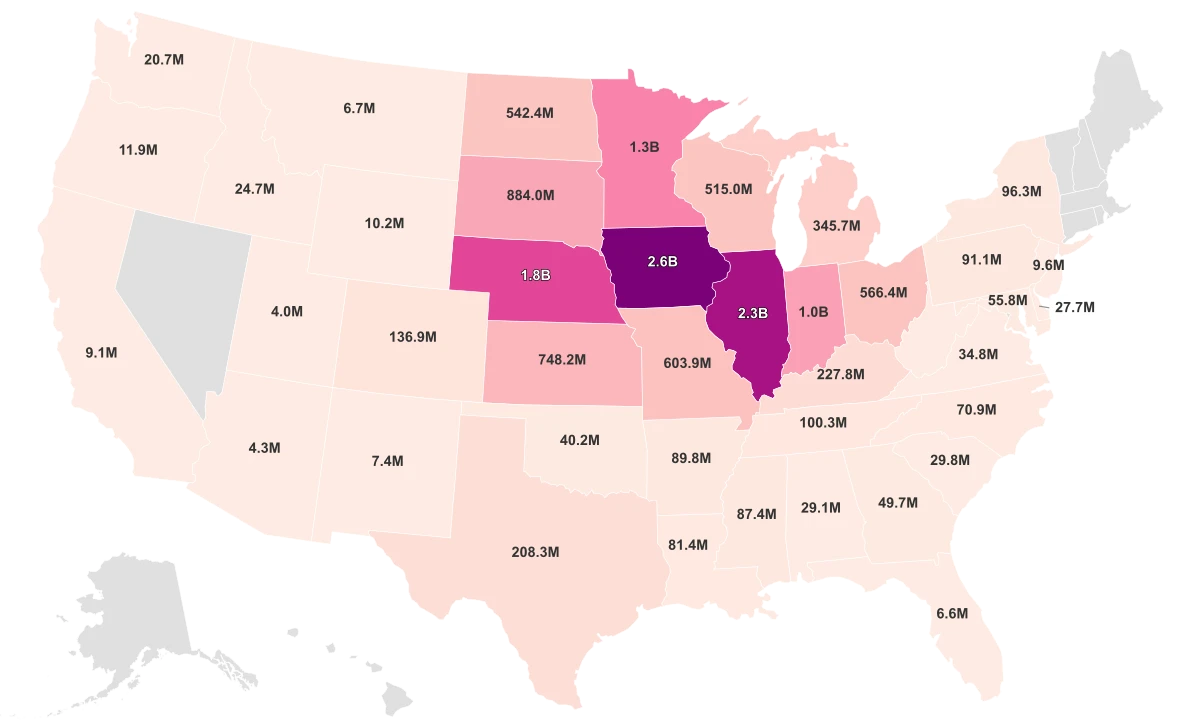
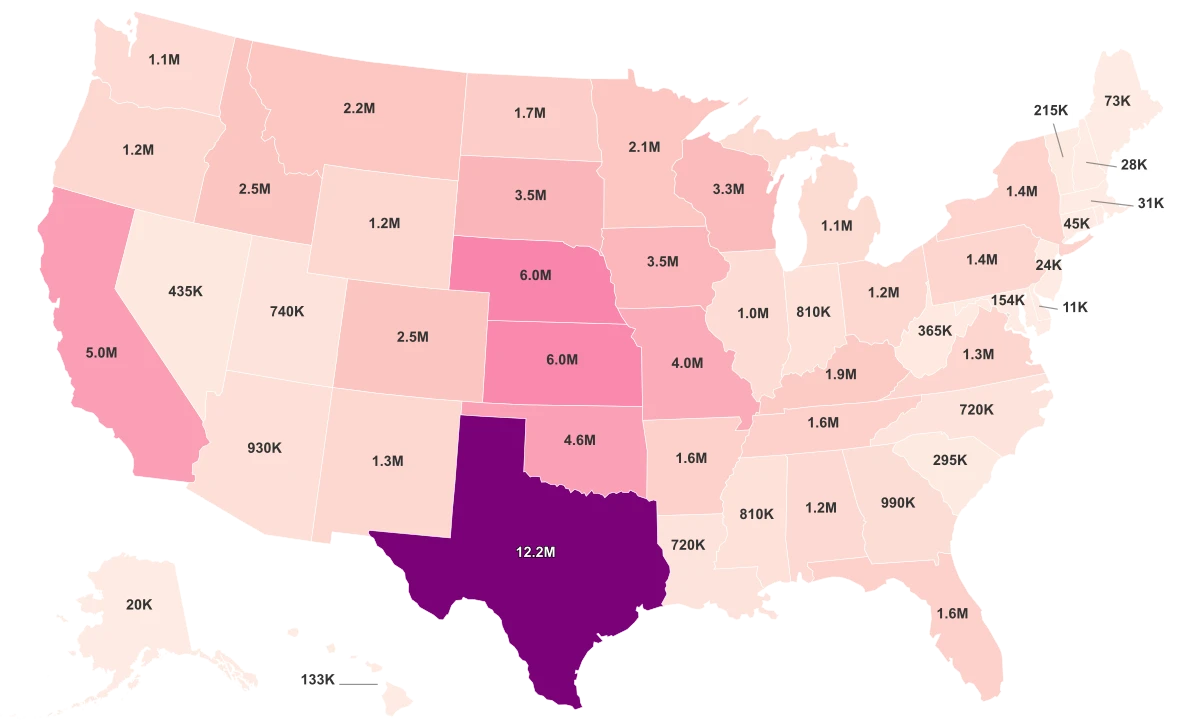
The national scale is enormous. USDA says the United States produced 27.0 billion pounds of beef in 2024. The center of gravity sits in the High Plains: Nebraska, Kansas, and Texas. Nebraska alone processed 6.86 million head. Those three states together handled nearly 59% of U.S. commercial cattle slaughter.
The concentration is far more extreme than a simple state ranking suggests. Most reported states process fewer than 100,000 head apiece. Nebraska alone processes nearly 7 million. A few giant plains states account for almost all the volume while the rest barely register.
Coverage is incomplete, but not trivial. USDA individually reports 37 states in this series. Even with withheld values and New England rolled up in the source tables, those states still account for more than 91% of national commercial cattle slaughter. That makes the missing states important, but not large enough to rewrite the basic geography of the industry.
Why Nebraska and Kansas Beat Texas
Texas is still the country's cattle capital. The January 2025 Cattle report puts its herd at 12.2 million head, roughly double Nebraska's inventory. But this page ranks where cattle are slaughtered, not where they spend most of their lives.
That distinction flips the map from a herd story to a plant story. Nebraska processed 6.86 million head in 2024. Kansas also cleared 6 million. Texas, despite its much larger herd, stayed below both at 5.46 million.
Texas also handles bigger animals. Its slaughter cattle averaged 1,437 pounds, compared with 1,176 in Nebraska. Yet Nebraska still led the live-weight ranking at 10.04 billion pounds. The story is not animal size. It is throughput.
The USDA Economic Research Service explains why. Cattle feeding is concentrated in the Great Plains and nearby Corn Belt. Feedlots with 1,000 or more head make up just 7 percent of operations, but they market about 88 percent of fed cattle. Once the business is organized around giant feeding and packing hubs, the top of the map becomes very hard to dislodge.
Where the Cattle Are Is Not Where the Slaughter Happens
The cleanest way to understand this ranking is to compare herd size with slaughter volume. Oklahoma had 4.6 million cattle at the start of 2025. It reported only 80,200 head slaughtered in-state during 2024. Missouri carried 3.95 million cattle. It reported only 108,900 head slaughtered.
That mismatch is not a bug. It is the supply chain. USDA ERS describes cattle moving from cow-calf operations into stocker or backgrounding programs, then into feedlots, then to slaughter plants. Animals can cross several state lines before they reach the packing plant that finally shows up in the production data.
Minnesota and Idaho are the sharper version of the same story. Idaho holds 2.49 million cattle. Minnesota has 2.09 million. Neither appears in the individually reported slaughter ranking because USDA withheld the state values. That does not mean beef production is absent there. It means the public slaughter series stops where disclosure would get too specific.
This is why herd maps and slaughter maps never quite match. One shows where cattle are located. The other shows where the industrial bottlenecks are.
What the Withheld States Actually Mean
The missing states are a disclosure problem, not a mystery. In the slaughter tables, USDA marks some values as withheld to avoid identifying individual operations. The agency also rolls the six New England states into a single regional line in the source report. That is why the page can rank 37 states individually but not all 50.
The caveat matters, but it does not erase the larger pattern. The individually reported states still account for more than 91 percent of national commercial cattle slaughter. The missing slice is real. It is just too small to knock Nebraska, Kansas, and Texas off the center of the map.
The safest way to read this page is as a map of where commercial beef processing is concentrated. It is not a perfect census of every state's beef economy. For the missing states, the cattle inventory metric gives the missing context: places such as Minnesota, Idaho, and Illinois still hold substantial herds even when the slaughter figure disappears.
That is also why this ranking feels more industrial than pastoral. It tells you where the packing plants are, where the big feedlots point, and where the modern beef chain narrows into a few dominant corridors.