Alcohol Consumption By Country

Last updated May 24, 2025

Alcohol Consumption per Capita
Top
Last
Alcohol Consumption per CapitaQuestion Mark
1LatviaLatvia13.19 L
2MoldovaMoldova12.85 L
3GermanyGermany12.79 L
4LithuaniaLithuania12.78 L
5IrelandIreland12.75 L
6SpainSpain12.67 L
7UgandaUganda12.48 L
8BulgariaBulgaria12.46 L
9LuxembourgLuxembourg12.45 L
10RomaniaRomania12.34 L
11AndorraAndorra12.26 L
12MontenegroMontenegro12.24 L
13FranceFrance12.23 L
14SloveniaSlovenia12.11 L
15PortugalPortugal12.09 L
16LaosLaos12.08 L
17TanzaniaTanzania12.04 L
18AustriaAustria11.93 L
19PolandPoland11.89 L
20United KingdomUnited Kingdom11.45 L
21SwitzerlandSwitzerland11.23 L
22HungaryHungary11.07 L
23SlovakiaSlovakia11.06 L
24Burkina FasoBurkina Faso11.05 L
25BelarusBelarus10.96 L
26Cook IslandsCook Islands10.94 L
27BelgiumBelgium10.80 L
27CyprusCyprus10.80 L
29EstoniaEstonia10.75 L
30New ZealandNew Zealand10.69 L
31FinlandFinland10.65 L
32RussiaRussia10.50 L
32GreeceGreece10.50 L
34BarbadosBarbados10.37 L
35AustraliaAustralia10.36 L
36DenmarkDenmark10.13 L
37JapanJapan10.09 L
38United StatesUnited States9.97 L
39NiueNiue9.93 L
40NetherlandsNetherlands9.67 L
41Saint LuciaSaint Lucia9.59 L
42GeorgiaGeorgia9.47 L
43ArgentinaArgentina9.45 L
43South AfricaSouth Africa9.45 L
45Antigua and BarbudaAntigua and Barbuda9.40 L
46IcelandIceland9.21 L
47SwedenSweden9.04 L
48GrenadaGrenada8.96 L
49ChileChile8.95 L
50SerbiaSerbia8.85 L
51SeychellesSeychelles8.84 L
52CanadaCanada8.81 L
53EswatiniEswatini8.78 L
54CroatiaCroatia8.73 L
55ThailandThailand8.50 L
56South KoreaSouth Korea8.45 L
57UkraineUkraine8.34 L
58MaltaMalta8.27 L
59GabonGabon8.08 L
60ItalyItaly8.01 L
61RwandaRwanda7.96 L
62VietnamVietnam7.93 L
63CambodiaCambodia7.84 L
64AngolaAngola7.83 L
65Bosnia and HerzegovinaBosnia and Herzegovina7.81 L
66PanamaPanama7.77 L
67BurundiBurundi7.45 L
68SurinameSuriname7.40 L
69BrazilBrazil7.32 L
70DominicaDominica7.23 L
71Saint Vincent and the GrenadinesSaint Vincent and the Grenadines7.15 L
72NorwayNorway7.14 L
73PhilippinesPhilippines7.02 L
74ParaguayParaguay7.01 L
75UruguayUruguay6.92 L
75Equatorial GuineaEquatorial Guinea6.92 L
77AlbaniaAlbania6.82 L
78PeruPeru6.78 L
79Dominican RepublicDominican Republic6.68 L
80BotswanaBotswana6.61 L
81Trinidad and TobagoTrinidad and Tobago6.52 L
82North MacedoniaNorth Macedonia6.43 L
83BelizeBelize6.37 L
84Saint Kitts and NevisSaint Kitts and Nevis6.34 L
85CubaCuba6.26 L
86NigeriaNigeria6.19 L
87ChinaChina6.04 L
88MongoliaMongolia5.90 L
89Sao Tome and PrincipeSao Tome and Principe5.80 L
90IndiaIndia5.61 L
91Guinea BissauGuinea Bissau5.54 L
92CameroonCameroon5.52 L
93ColombiaColombia5.45 L
94LiberiaLiberia5.37 L
95GuyanaGuyana5.33 L
96Sierra LeoneSierra Leone5.31 L
97LesothoLesotho5.08 L
98NicaraguaNicaragua5.07 L
99MexicoMexico5.05 L
100KazakhstanKazakhstan5.00 L
101KyrgyzstanKyrgyzstan4.85 L
102BahamasBahamas4.80 L
103MauritiusMauritius4.78 L
104ArmeniaArmenia4.67 L
105ZimbabweZimbabwe4.52 L
106ZambiaZambia4.46 L
107IsraelIsrael4.38 L
108NauruNauru4.18 L
109JamaicaJamaica4.16 L
109North KoreaNorth Korea4.16 L
111El SalvadorEl Salvador4.09 L
112MalawiMalawi4.08 L
113Costa RicaCosta Rica4.07 L
114HondurasHonduras3.93 L
115BoliviaBolivia3.91 L
116United Arab EmiratesUnited Arab Emirates3.85 L
117FijiFiji3.68 L
118VenezuelaVenezuela3.56 L
119GambiaGambia3.36 L
120EcuadorEcuador3.27 L
121NamibiaNamibia3.15 L
122TurkmenistanTurkmenistan3.09 L
123Ivory CoastIvory Coast3.04 L
124HaitiHaiti3.02 L
125Sri LankaSri Lanka2.87 L
126SamoaSamoa2.82 L
127MaldivesMaldives2.78 L
127GhanaGhana2.78 L
129MozambiqueMozambique2.69 L
130TogoTogo2.66 L
131UzbekistanUzbekistan2.61 L
132MicronesiaMicronesia2.51 L
133KiribatiKiribati2.32 L
134BeninBenin2.23 L
135EthiopiaEthiopia2.20 L
136KenyaKenya2.15 L
137MyanmarMyanmar2.14 L
138Papua New GuineaPapua New Guinea2.12 L
139EritreaEritrea2.11 L
140VanuatuVanuatu2.10 L
141TunisiaTunisia2.04 L
142SingaporeSingapore2.00 L
143MadagascarMadagascar1.98 L
144TurkeyTurkey1.77 L
145Solomon IslandsSolomon Islands1.74 L
146Central African RepublicCentral African Republic1.71 L
147GuatemalaGuatemala1.63 L
148LebanonLebanon1.53 L
149QatarQatar1.51 L
150MaliMali1.31 L
150TuvaluTuvalu1.31 L
152ChadChad1.26 L
153ComorosComoros1.15 L
154BahrainBahrain1.13 L
155DR CongoDR Congo1.10 L
156GuineaGuinea1.09 L
157IranIran1.01 L
158AzerbaijanAzerbaijan0.98 L
159MalaysiaMalaysia0.93 L
160OmanOman0.92 L
161TajikistanTajikistan0.88 L
162SenegalSenegal0.73 L
163AlgeriaAlgeria0.63 L
164NepalNepal0.62 L
165Timor LesteTimor Leste0.53 L
166NigerNiger0.52 L
166JordanJordan0.52 L
168MoroccoMorocco0.49 L
169BruneiBrunei0.46 L
170TongaTonga0.43 L
171IraqIraq0.37 L
172DjiboutiDjibouti0.36 L
173PakistanPakistan0.31 L
174IndonesiaIndonesia0.22 L
175BhutanBhutan0.21 L
176SyriaSyria0.19 L
177EgyptEgypt0.14 L
178LibyaLibya0.03 L
178YemenYemen0.03 L
180AfghanistanAfghanistan0.01 L

Global Alcohol Consumption Patterns

Alcohol consumption rates can reveal noteworthy socio-economic and cultural patterns and have significant public health implications. Understanding these consumption trends and their impacts is critical for national healthcare services, liquor industries, policymakers, and anyone looking to gain a more comprehensive perspective on global drinking habits.

Key findings from the data include:

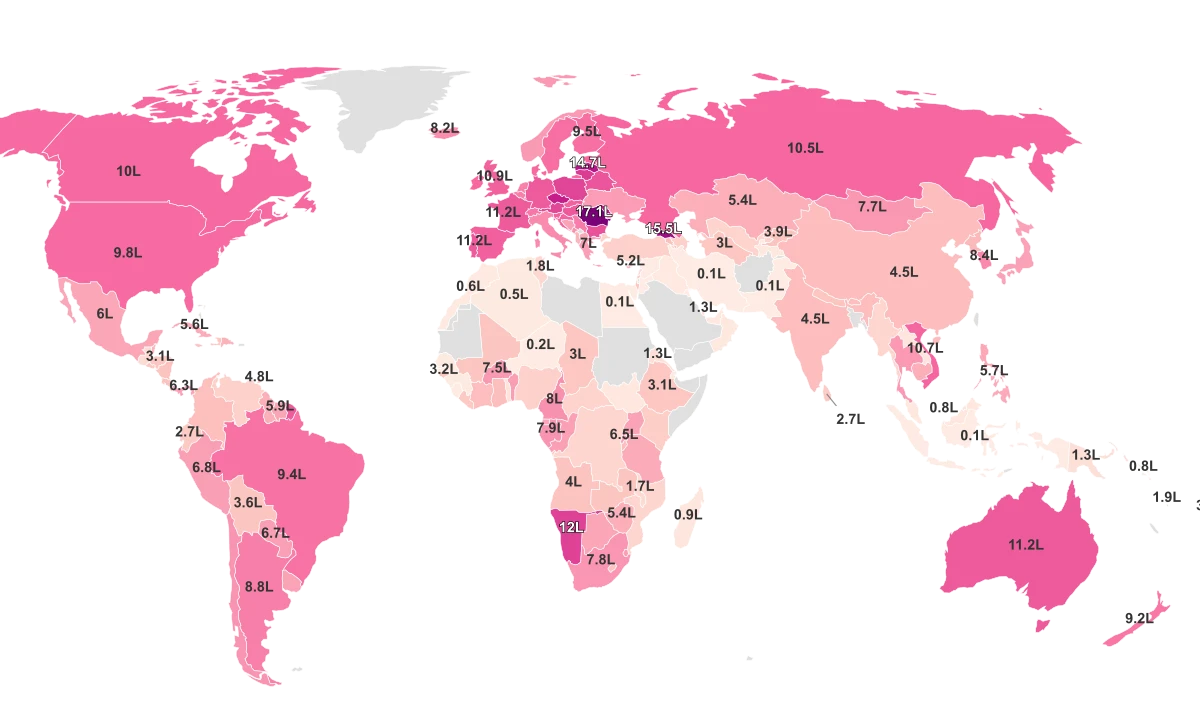
  • Latvia leads the world in per capita alcohol consumption at 13.19L, followed closely by Moldova (12.85L), Germany (12.79L), and Lithuania (12.78L).
  • In comparison to these countries, the United States ranks lower, with a per capita alcohol consumption of 9.97L.
  • On the other end of the spectrum, countries such as Afghanistan and Libya exhibit exceptionally low rates of alcohol consumption at just 0.01L and 0.03L, respectively, likely influenced by the prevalent religious beliefs and related legal restrictions within these societies.
  • European nations generally report higher rates of alcohol consumption, with countries like Ireland (12.75L), Spain (12.67L), and Romania (12.34L) showing significant figures. This could be attributed to cultural factors, such as traditional drinking norms and practices.
  • In contrast, alcohol consumption seems to be much lower across many Asian countries, such as Indonesia (0.22L) and Pakistan (0.31L), where cultural and religious beliefs often discourage alcohol use.

Countries that Drink the Most

When it comes to the amount of alcohol consumed per capita, Latvia tops the list at 13.19 liters per person annually. A close second is Moldova with an average consumption of 12.85 liters per person. In third place, we have Germany with an annual alcohol consumption of 12.79 liters per capita. Coming in closely at fourth place is Lithuania with 12.78 liters per capita, followed by Ireland at fifth, consuming an average of 12.75 liters of alcohol per person, per year.

In the sixth position, Spain records a per capita consumption of 12.67 liters annually, just slightly ahead of Uganda's 12.48 liters. Bulgarian citizens consume an average of 12.46 liters earning the Eastern European country the eighth spot. The grand duchy of Luxembourg is not far behind with 12.45 liters per capita, while Romania completes the list of top ten countries in alcohol consumption, with an average of 12.34 liters.

Countries with the Highest Alcohol Consumption (Per Capita):

  1. Latvia - 13.19L
  2. Moldova - 12.85L
  3. Germany - 12.79L
  4. Lithuania - 12.78L
  5. Ireland - 12.75L
  6. Spain - 12.67L
  7. Uganda - 12.48L
  8. Bulgaria - 12.46L
  9. Luxembourg - 12.45L
  10. Romania - 12.3

Countries that Drink the Least

The ten countries with the lowest alcohol consumption per capita are Afghanistan, Libya, Yemen, Egypt, Syria, Bhutan, Indonesia, Pakistan, Djibouti, and Iraq. The lowest alcohol consumption per capita is observed in Afghanistan, where the average consumption is a mere 0.01 liters per person. Following Afghanistan are Libya and Yemen, which both have an average alcohol consumption of 0.03 liters per person.

Egypt records a slightly higher consumption, at 0.14 liters per capita. Meanwhile, Syria's average consumption stands at 0.19 liters per capita. Bhutan and Indonesia report similarly low levels, with consumption rates at 0.21 liters and 0.22 liters per capita, respectively.

A bit higher on the spectrum, Pakistan observes an average of 0.31 liters of alcohol consumed per capita. The remaining countries with the lowest alcohol consumption per capita are Djibouti and Iraq, recording 0.36 liters and 0.37 liters, respectively.

Countries with the lowest alcohol consumption (per capita):

  1. Afghanistan - 0.01 L
  2. Libya - 0.03 L
  3. Yemen - 0.03 L
  4. Egypt - 0.14 L
  5. Syria - 0.19 L
  6. Bhutan - 0.21 L
  7. Indonesia - 0.22 L
  8. Pakistan - 0.31 L
  9. Djibouti - 0.36 L
  10. Iraq - 0.37 L
Keep reading

Additional Rankings

Amish Population

Amish Population

Asian Population By State

Asian Population By State

Autism Rates By Country
Health
Countries

Autism Rates By Country

Average Age To Lose Virginity By Country
Miscellaneous
Countries

Average Age To Lose Virginity By Country

Average Height By Country
Demographics
Countries

Average Height By Country

Average Height By State

Average Height By State