Asian-Americans Across States
The United States offers a vibrant and diverse cultural tapestry, woven into every corner of the nation. An integral part of this rich tableau is the Asian-American community, a heterogeneous group with roots stretching back to numerous countries across Asia. From the early settlement of Manilamen in Louisiana to the large waves of immigration after 1965, Asian-Americans have forged an indelible mark on the shaping and evolution of the America we know today. In the 2020 U.S. Census, a notable 24 million people identified as Asian American, making up 7.2% of the total population. This article examines the distribution of this population across the 50 U.S. states and the District of Columbia.
Key findings from the data include:
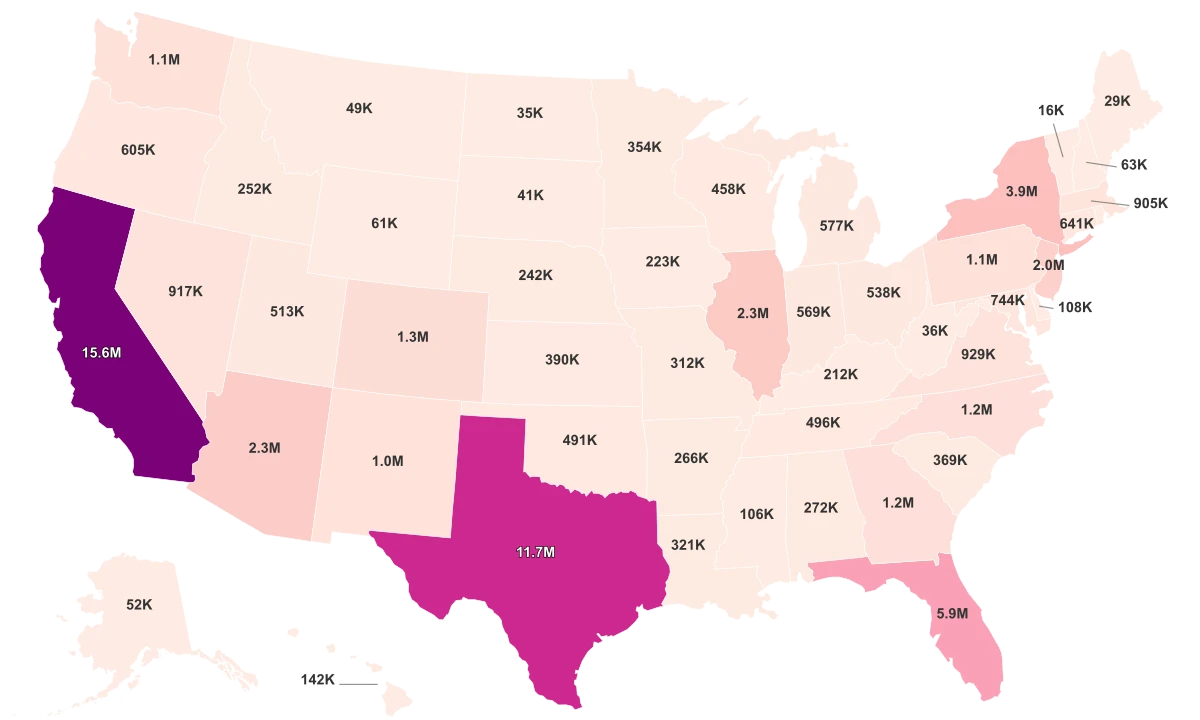
- California, with 6.8 million Asian-Americans, has the highest Asian population in the U.S. It is significantly larger than that of New York and Texas, the states with the second and third largest populations, which have 1.9 million and 1.7 million Asian residents, respectively.
- Thirteen states have an Asian population of over half a million, reflecting a higher degree of Asian-American presence on both coasts of the country and in the Hawaiian Islands.
- The Asian population seems to be concentrated more in the West Coast and Northeast states, a trend well-documented by the fact that western states such as California and Washington, and northeastern states like New York and New Jersey, all rank in the top five states with the highest Asian populations.
- Of the 51 regions ranked, the bottom five - North Dakota, South Dakota, Montana, Vermont, and Wyoming - each have an Asian population of less than 20,000, reflecting the lower Asian-American density in sparsely populated or rural states.
- Despite making up a quarter of all immigrants to the U.S. since 1965, and with 59% of Asian-Americans being foreign-born, the distribution pattern still appears to be heavily influenced by urbanization and economic opportunities that are concentrated in coastal states.
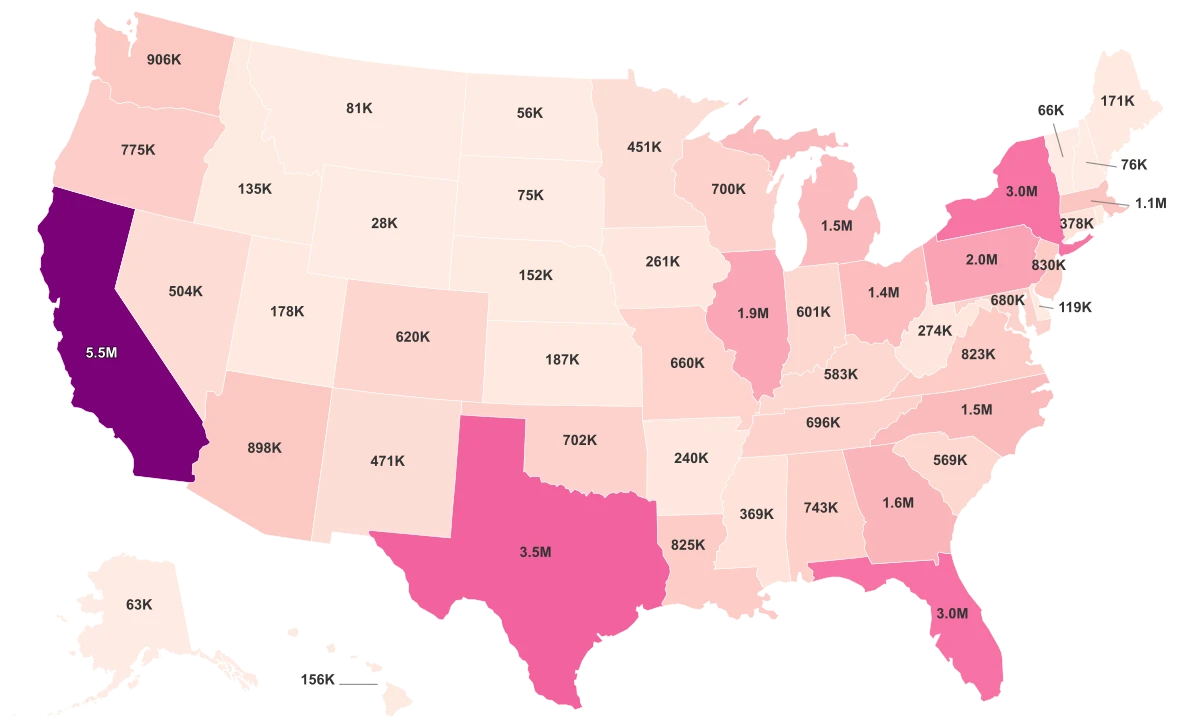
States with Most Asian Population
Heading the list from our data set is California, boasting an impressive total Asian population of 6.8 million. This makes California the state with the largest concentration of Asian-Americans by far, a testament to its rich history of immigration and cultural diversity.
Second on the list is the state of New York, home to approximately 1.9 million Asian-Americans. New York City, in particular, has a prominent Asian presence made evident by neighborhoods such as Chinatown, Koreatown, and Little India which emphasize the state's cultural wealth.
Landing third is Texas, with a significant Asian population of around 1.7 million. Texas' growing economy and multicultural cities make it a sought-after destination for immigrants. New Jersey ranks fourth, hosting approximately 949,000 Asian-Americans. Asian influence can be seen in cities such as Jersey City with its bustling "Little India" neighborhood. Washington fills the fifth spot, harboring approximately 854,600 Asian-Americans, underlining the trend of higher Asian-American presence on the West Coast.
Illinois and Hawaii feature next with sizable Asian populations of around 828,800 and 803,300 respectively, followed by Florida and Virginia, each with a population of over 690,000. Wrapping up our top 10 list is Massachusetts, home to roughly 538,400 Asian-Americans.
States with Most Asian Population:
- California - 6.8M
- New York - 1.9M
- Texas - 1.7M
- New Jersey - 949.0K
- Washington - 854.6K
- Illinois - 828.8K
- Hawaii - 803.3K
- Florida - 763.6K
- Virginia - 691.4K
- Massachusetts - 538.4K