
The Entire Range From Tallest to Shortest Fits Inside Two Inches
The federal government asks hundreds of thousands of adults their height every year through the CDC's Behavioral Risk Factor Surveillance System, a telephone survey that reaches all 50 states. The 2023 data covers 48 states, with Kentucky and Pennsylvania missing from that year's release. The result is the most comprehensive state-level height dataset available, even if it depends on people telling the truth about how tall they are.
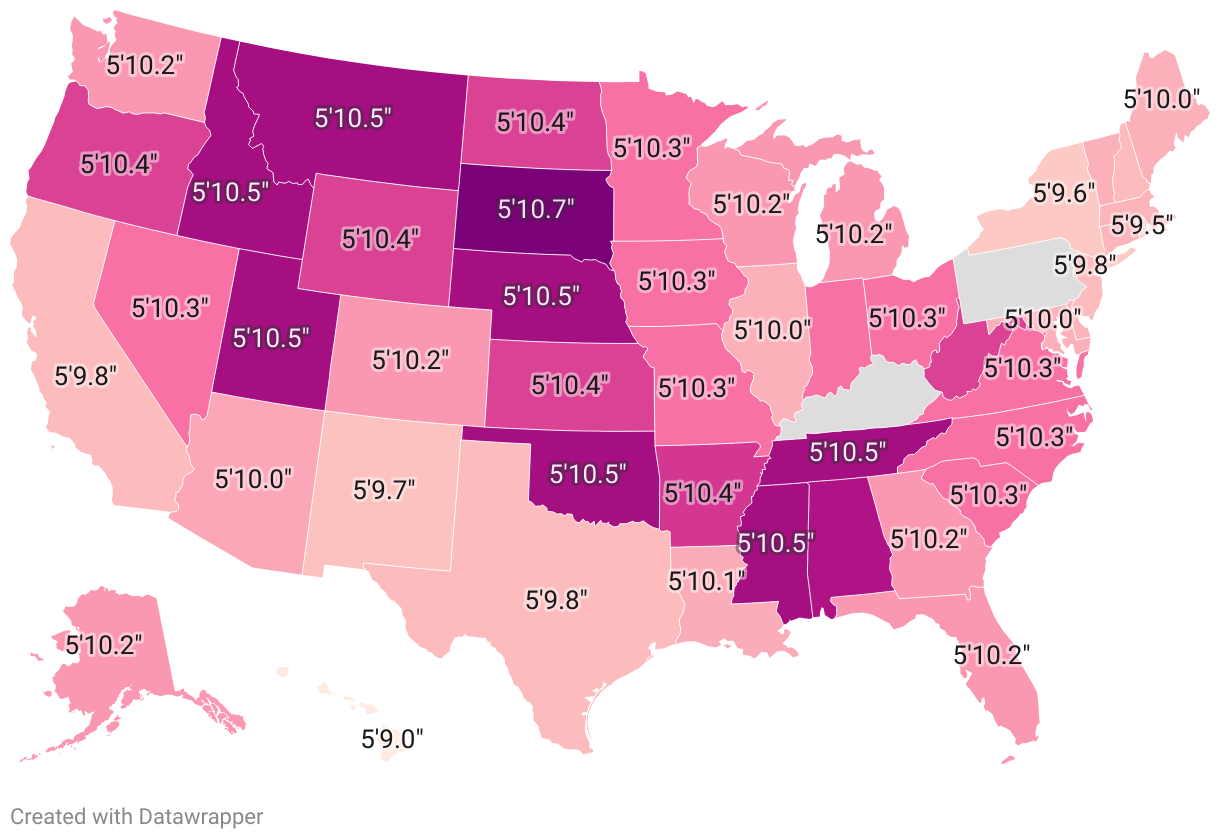
The gap between the tallest and shortest states is smaller than most people expect. For men, South Dakota leads at 70.7 inches. Hawaii anchors the bottom at 69.0 inches. That is a total spread of 1.7 inches across the entire country.
For women, the picture is nearly identical. Utah leads at 64.7 inches and Hawaii again trails at 63.3 inches. The gap is just 1.4 inches.
Between those endpoints, the data is remarkably flat. Eight states are tied at 70.5 inches for second place. Most of the country clusters within a few tenths of an inch of each other, packed so tightly that the rankings are almost arbitrary in the middle.
That compression means the rankings are volatile. A 0.1-inch shift in a state's self-reported average can move it a dozen spots. The interesting question is not which state ranks 14th versus 22nd. It is why the states at the very top and the very bottom ended up where they did.
The Tallest States Share a Common Ancestor
The tallest cluster on the map traces a line through the Northern Great Plains and the Upper Midwest. South Dakota, Montana, Nebraska, and Minnesota anchor one end. Idaho, Wyoming, Kansas, and North Dakota fill in the rest. Every one of these states sits at or above 70.4 inches for men. The pattern is not a coincidence. It is a settlement map.
During the 19th and early 20th centuries, these states received some of the heaviest Scandinavian and Northern European immigration in the country. Minnesota and the Dakotas drew enormous waves of settlers from Norway, Sweden, and Denmark. These populations are among the tallest in the world, and their descendants carried those genetic profiles into the American interior.
Genetics account for roughly 60 to 80 percent of adult height, with nutrition and environment covering the rest. That share is large enough to show up clearly at the state level when certain ancestry groups concentrate in specific regions. The regional averages confirm the pattern: the Midwest averages 70.33 inches for men, while the Northeast averages 69.81. That half-inch gap is the largest regional divide in the data.
The South sits in between at 70.26. Several Southern states rank near the very top individually, matching or exceeding Midwestern averages. But the regional number gets pulled down by Texas (69.8 inches) and Florida (70.2 inches), both of which have large Hispanic populations that shift the demographic composition.
Why Hawaii Sits a Full Inch Below Every Other State
Hawaii is the only true outlier in this dataset. At 69.0 inches for men and 63.3 inches for women, it sits more than a full inch below the next-shortest state. The gap between Hawaii and Rhode Island (the second-shortest for men at 69.5 inches) is half an inch, which in a dataset this compressed is enormous.
The explanation is demographic, not medical. Hawaii is the only U.S. state where the majority of the population is Asian. According to Census Bureau data, roughly 57 percent of Hawaii's residents identify as Asian. NHANES measured-height data shows that Asian American men average about 5 feet 7 inches, roughly three inches shorter than the White male average of 5 feet 10 inches. When more than half a state's population descends from populations with genetically shorter average stature, the state average reflects that composition.
The same dynamic, in smaller doses, explains the other states near the bottom. New Mexico (69.7 inches for men) has one of the highest Hispanic population shares in the country. California (69.8 inches) has both the largest Asian American population in absolute numbers and a Hispanic population exceeding 39 percent. Rhode Island (69.5 inches) has experienced significant immigration from Central America and Southeast Asia over the past two decades.
For women, the pattern is identical. Hawaii, New Mexico, and Rhode Island occupy the same bottom positions. The male-female correlation across all 48 states is extremely tight: states where men are tall are states where women are tall, with almost no exceptions. The forces that shape one metric shape both.
None of this reflects anything about health, nutrition, or quality of life. It is a map of where people's ancestors came from.
Everyone Rounds Up: What Self-Reported Height Actually Measures
The BRFSS is a telephone survey. Nobody shows up with a tape measure. That matters, because people consistently overestimate their own height. A 2009 study published in Preventing Chronic Disease compared self-reported heights from NHANES interviews against physical measurements taken the same day. Men overreported their height by an average of 0.48 inches. Women overreported by 0.27 inches.
The bias is not random. It gets worse with age. After 50, men's overestimation increases significantly, likely because people remember the height on their driver's license from decades earlier while they have actually been shrinking. A 2020 analysis in the journal Obesity comparing BRFSS, NHIS, and NHANES data from 1999 to 2016 found the same pattern: self-reported surveys consistently produce taller, lighter populations than measured ones.
For context, the NHANES national average for measured male height is 69.1 inches. The BRFSS self-reported average across 48 states in this dataset is 70.17 inches, more than a full inch higher. Some of that gap reflects the two missing states and different sample designs, but self-report inflation is the primary driver.
The practical takeaway is that these state rankings are best read as relative, not absolute. South Dakota's men are almost certainly taller on average than Hawaii's men. But the actual numbers are probably all about half an inch lower than what the survey reports. The ranking order holds up. The decimal places do not.