Wine Production by Country

Last updated May 23, 2025

Wine Production
Wine Production per Person
Grape Production
Grape Production per Person
Top
Last
Wine Production 2020Question Mark
1ItalyItaly4.8M
2SpainSpain4.6M
3FranceFrance4.3M
4United StatesUnited States3.3M
5ChinaChina1.7M
6ArgentinaArgentina1.5M
7ChileChile1.2M
8AustraliaAustralia1.2M
9South AfricaSouth Africa1.1M
10GermanyGermany920.2K
11PortugalPortugal603.3K
12RomaniaRomania378.3K
13GreeceGreece334.3K
14RussiaRussia327.4K
15New ZealandNew Zealand320.4K
16BrazilBrazil273.1K
17HungaryHungary258.5K
18AustriaAustria199.9K
19SerbiaSerbia198.2K
20MoldovaMoldova149.9K
21BulgariaBulgaria130.5K
22GeorgiaGeorgia108.6K
23SwitzerlandSwitzerland93.4K
24UkraineUkraine86.9K
25JapanJapan85.0K
26PeruPeru73.0K
27UruguayUruguay72.5K
28CanadaCanada54.7K
29Czech RepublicCzech Republic52.0K
29AlgeriaAlgeria52.0K
31North MacedoniaNorth Macedonia51.0K
32CroatiaCroatia45.3K
33TurkeyTurkey44.7K
34MexicoMexico39.4K
35TurkmenistanTurkmenistan39.0K
36MoroccoMorocco37.0K
37UzbekistanUzbekistan36.0K
38SlovakiaSlovakia32.5K
39BelarusBelarus30.0K
40KazakhstanKazakhstan22.0K
41TunisiaTunisia21.5K
42AlbaniaAlbania17.5K
43MontenegroMontenegro16.0K
44LebanonLebanon14.7K
45SloveniaSlovenia13.2K
46ColombiaColombia13.0K
47LuxembourgLuxembourg12.5K
48CubaCuba12.1K
49EstoniaEstonia11.1K
50CyprusCyprus10.3K
51AzerbaijanAzerbaijan9.5K
52BoliviaBolivia9.4K
53MadagascarMadagascar8.4K
54Bosnia and HerzegovinaBosnia and Herzegovina7.5K
55ArmeniaArmenia6.2K
56LithuaniaLithuania6.0K
57EgyptEgypt5.0K
57IsraelIsrael5.0K
59BelgiumBelgium2.9K
60LatviaLatvia2.5K
61MaltaMalta2.4K
62ZimbabweZimbabwe1.8K
63KyrgyzstanKyrgyzstan1.7K
64ParaguayParaguay1.5K
65EthiopiaEthiopia1.3K
66JordanJordan550
67United KingdomUnited Kingdom425
68PanamaPanama159
69TajikistanTajikistan150
70LiechtensteinLiechtenstein79
71SyriaSyria70

Global Wine Production

The bountiful world of wine production stretches far and wide across the globe, with each region offering unique varieties, tastes, and experiences that contribute to the global wine industry's vibrancy. With a fascinating history and culture woven around it, wine production trends offer insights into the agricultural resources, economic conditions, and preferences of wine enthusiasts worldwide.

Key Insights:

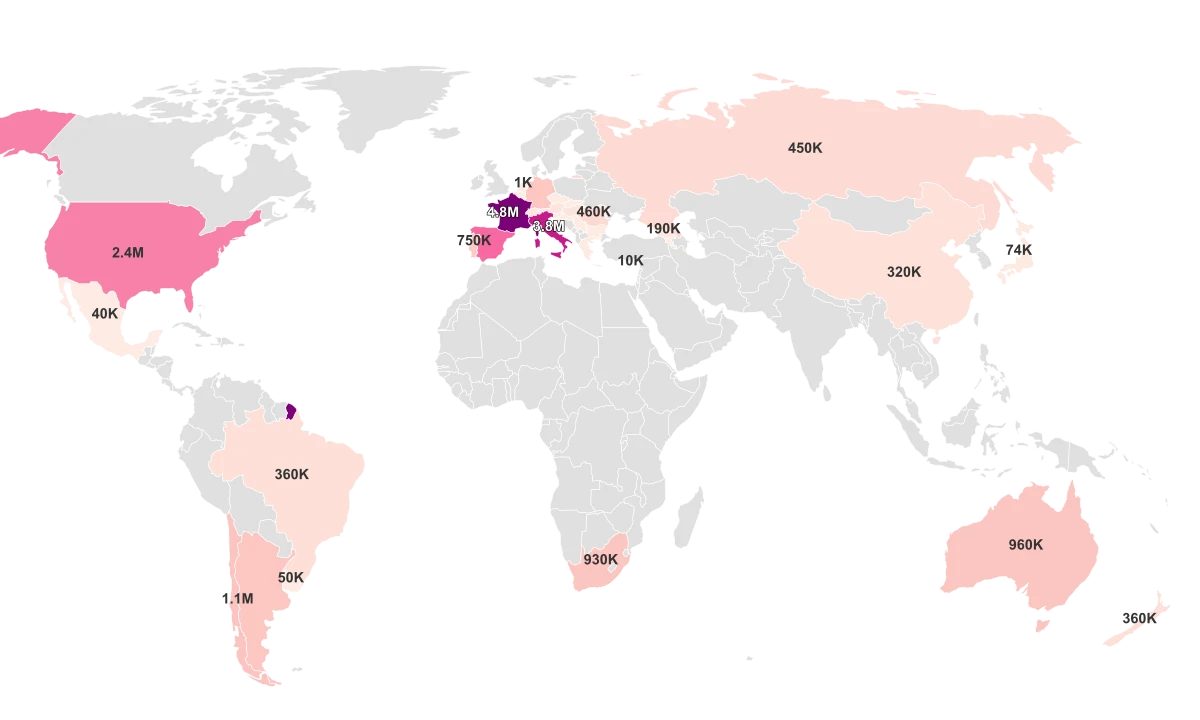
  • Italy is the global leader in wine production, producing approximately 4.8 million tons. Spain and France follow Italy, with 4.6 million and 4.3 million tons of wine, respectively.
  • The United States's 3.3 million tons of wine production reflects the country's flourishing vineyards and the wine industry's significant contribution to its economy.
  • On the Asian front, China emerges prominently, producing about 1.7 million tons, underscoring Asia's growing enthusiasm for wine culture.
  • Despite being recognized for their world-class wines, Argentina, Chile, and Australia display similar production benchmarks, each producing around 1.2 million tons.
  • Surprisingly, countries traditionally associated with beer, like Germany, also have a strong wine production stance, punctuating the list at nearly 920.2K tons of wine.

Region ↕Wine Production 2020↕Wine Production per Person 2020↕Grape Production↕Grape Production per Person↕
Italy4.8M79.378.2M135.71
Spain4.6M98.765.9M127.18
France4.3M63.806.2M92.83
United States3.3M10.077.1M21.66
China1.7M1.2214.8M10.65
Argentina1.5M33.681.8M39.52
Chile1.2M69.082.5M140.75
Australia1.2M47.361.8M70.78
South Africa1.1M19.852.0M34.80
Germany920.2K11.121.2M14.81
Portugal603.3K58.63773.9K75.20
Romania378.3K19.38736.9K37.74
Greece334.3K31.05990.3K91.96
Russia327.4K2.23551.7K3.76
New Zealand320.4K65.37408.5K83.36
Brazil273.1K1.30984.5K4.70
Hungary258.5K26.46423.0K43.29
Austria199.9K22.61260.3K29.46
Serbia198.2K28.31145.8K20.83
Moldova149.9K42.20615.7K173.40
Bulgaria130.5K18.51211.1K29.94
Georgia108.6K29.12159.2K42.69
Switzerland93.4K10.99136.4K16.06
Ukraine86.9K2.06377.8K8.94
Japan85.0K0.67179.2K1.42
Peru73.0K2.34690.0K22.09
Uruguay72.5K20.68104.5K29.81
Canada54.7K1.4790.9K2.44
Czech Republic52.0K4.9075.9K7.15
Algeria52.0K1.22571.0K13.42
North Macedonia51.0K24.58333.3K160.61
Croatia45.3K10.80123.7K29.50
Turkey44.7K0.554.0M49.50
Mexico39.4K0.32351.3K2.82
Turkmenistan39.0K6.67287.9K49.21
Morocco37.0K1.06364.9K10.49
Uzbekistan36.0K1.101.6M50.30
Slovakia32.5K5.9837.8K6.95
Belarus30.0K3.1617.4K1.83
Kazakhstan22.0K1.2075.0K4.11
Tunisia21.5K1.88134.0K11.71
Albania17.5K6.10205.0K71.42
Montenegro16.0K25.7122.7K36.55
Lebanon14.7K2.4169.4K11.39
Slovenia13.2K6.4094.8K45.86
Colombia13.0K0.2625.0K0.50
Luxembourg12.5K20.7511.0K18.33
Cuba12.1K1.0821.8K1.94
Estonia11.1K8.42
Cyprus10.3K12.0519.9K23.23
Azerbaijan9.5K0.96136.5K13.79
Bolivia9.4K0.8321.2K1.87
Madagascar8.4K0.3213.4K0.51
Bosnia and Herzegovina7.5K1.9936.9K9.75
Armenia6.2K2.08178.8K60.19
Lithuania6.0K2.14
Egypt5.0K0.0511.7M17.61
Israel5.0K0.5666.0K7.41
Belgium2.9K0.252.3K0.197
Latvia2.5K1.27
Malta2.4K5.103.7K7.79
Zimbabwe1.8K0.123.3K0.224
Kyrgyzstan1.7K0.278.6K1.36
Paraguay1.5K0.211.9K0.272
Ethiopia1.3K0.0125.4K0.050
Jordan5500.05462.3K6.09
United Kingdom4250.0064490.007
Panama1590.038
Tajikistan1500.017214.8K24.05
Liechtenstein792.072155.64
Syria700.004265.8K14.54

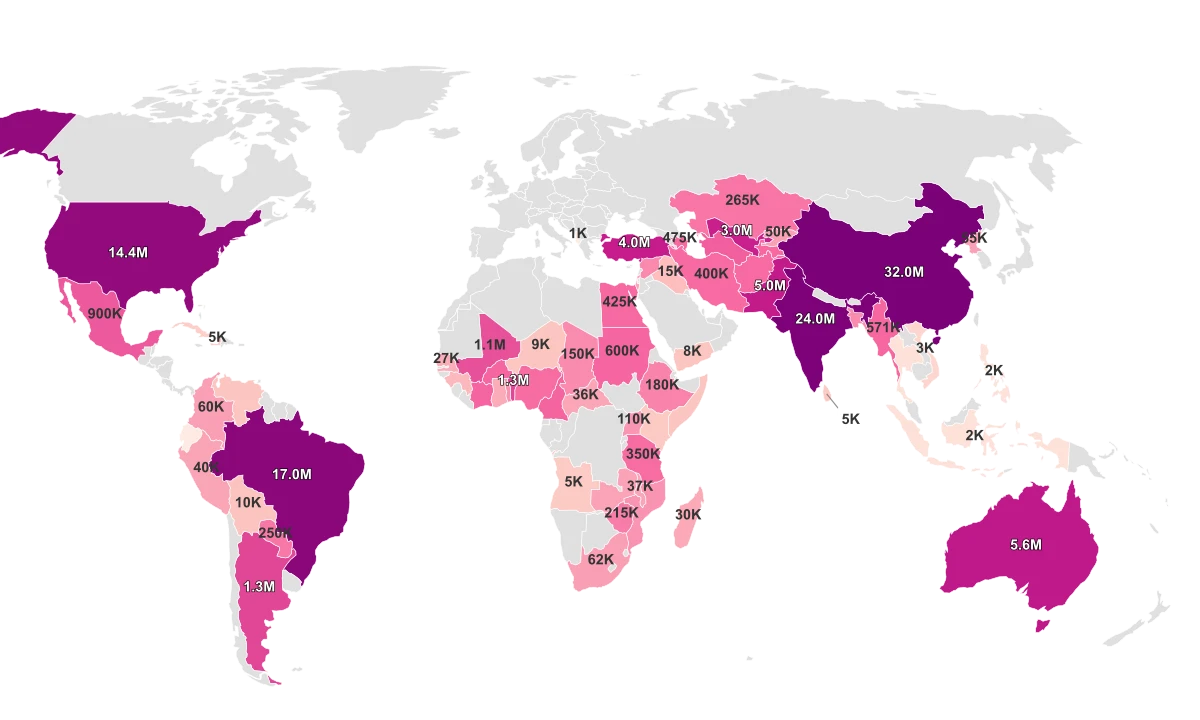
Top Wine Producing Countries

Our top ten global vineyards contribute immensely to the wine industry, producing millions of tons of wine annually. Italy leads the pack with an impressive 4.8 million tons of wine production each year. Close on its heels is Spain, with an annual wine production of 4.6 million tons. France, commonly associated with high-quality wines, comes in third with 4.3 million tons. The United States, home to famous wine regions such as Napa Valley and Sonoma, ranks in fourth place with an annual production of 3.3 million tons. At a considerable distance, but not to be overlooked, China ranks fifth with 1.7 million tons. Argentina, known for its world-class Malbec, produces 1.5 million tons annually. Chile, Australia, and South Africa follow closely producing 1.2 million, 1.2 million, and 1.1 million tons respectively. Finally, rounding off our top ten is Germany, which despite its colder climate manages to produce 920.2 thousand tons of wine each year. 10 Countries with the Highest Wine Production:

  1. Italy - 4.8M tons
  2. Spain - 4.6M tons
  3. France - 4.3M tons
  4. United States - 3.3M tons
  5. China - 1.7M tons
  6. Argentina - 1.5M tons
  7. Chile - 1.2M tons
  8. Australia - 1.2M tons
  9. South Africa - 1.1M tons
  10. Germany - 920.2K tons
Last updated
February 27, 2025
Keep reading

Additional Rankings

Worst Countries To Live In
Miscellaneous
Countries

Worst Countries To Live In

Worst Drivers By State
Rankings
States

Worst Drivers By State

Worst States To Live In
Rankings
States

Worst States To Live In

Age Of Consent By State

Age Of Consent By State

Age of Consent by Country
Miscellaneous
Countries

Age of Consent by Country

Air Quality By State
Health
States

Air Quality By State