A Fivefold Gap Separates the Cheapest and Most Expensive Water in America
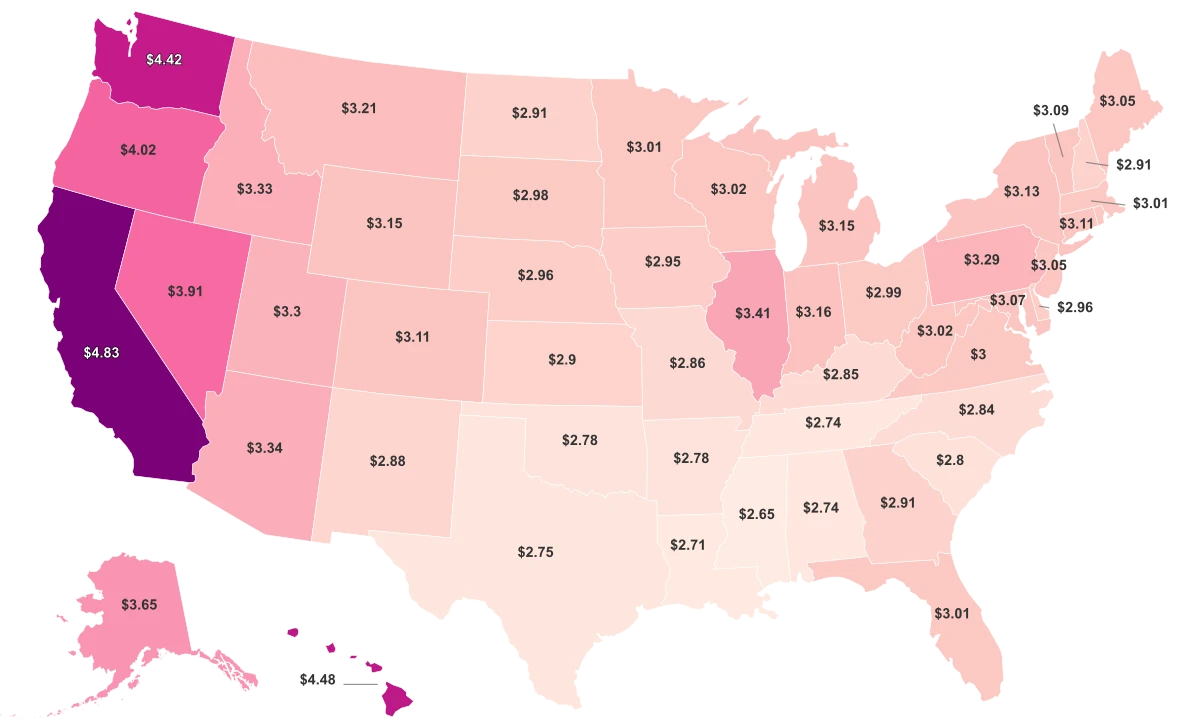
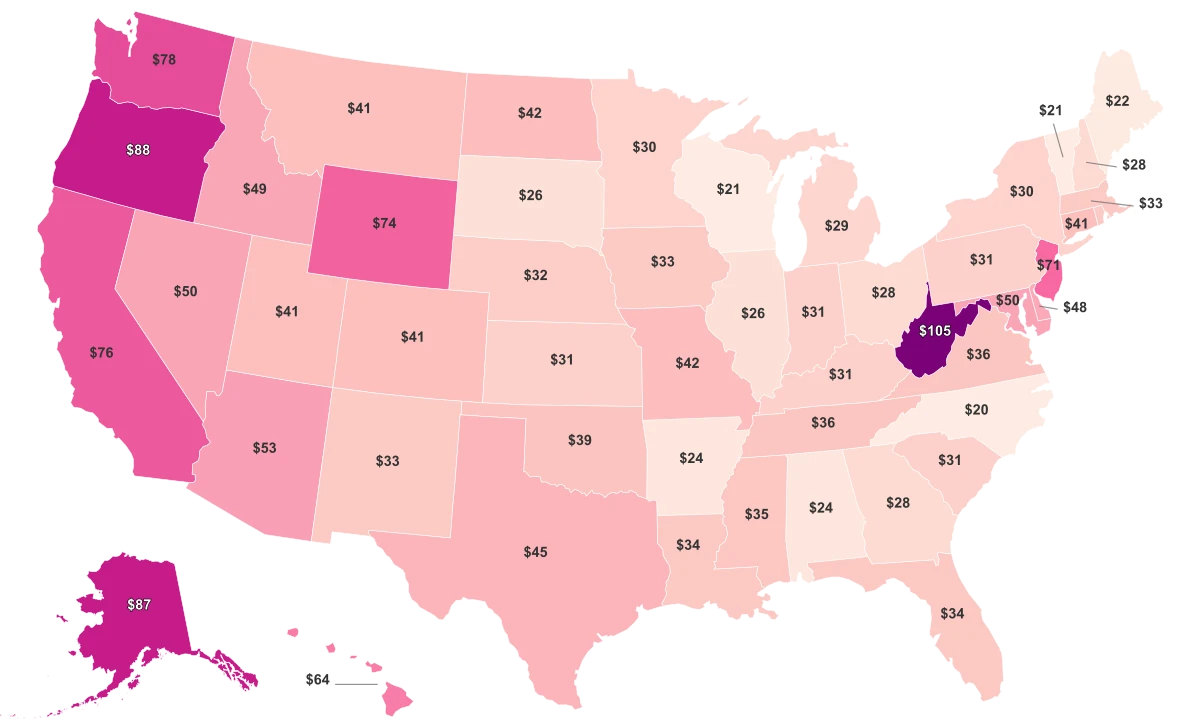
The cheapest water in the country costs about the same as a fast-food lunch. The most expensive costs more than most people's internet bill. North Carolina residents pay an average of $20 per month. West Virginia residents pay $105. That is a fivefold gap for the same basic utility, in states that share a border.
The national average sits at roughly $42 per month, but that number is misleading. The median is just $34, pulled up by a handful of expensive outliers in the West and Appalachia. Most states cluster between $25 and $50, with a steep jump to the top tier. Only seven states top $60 per month.
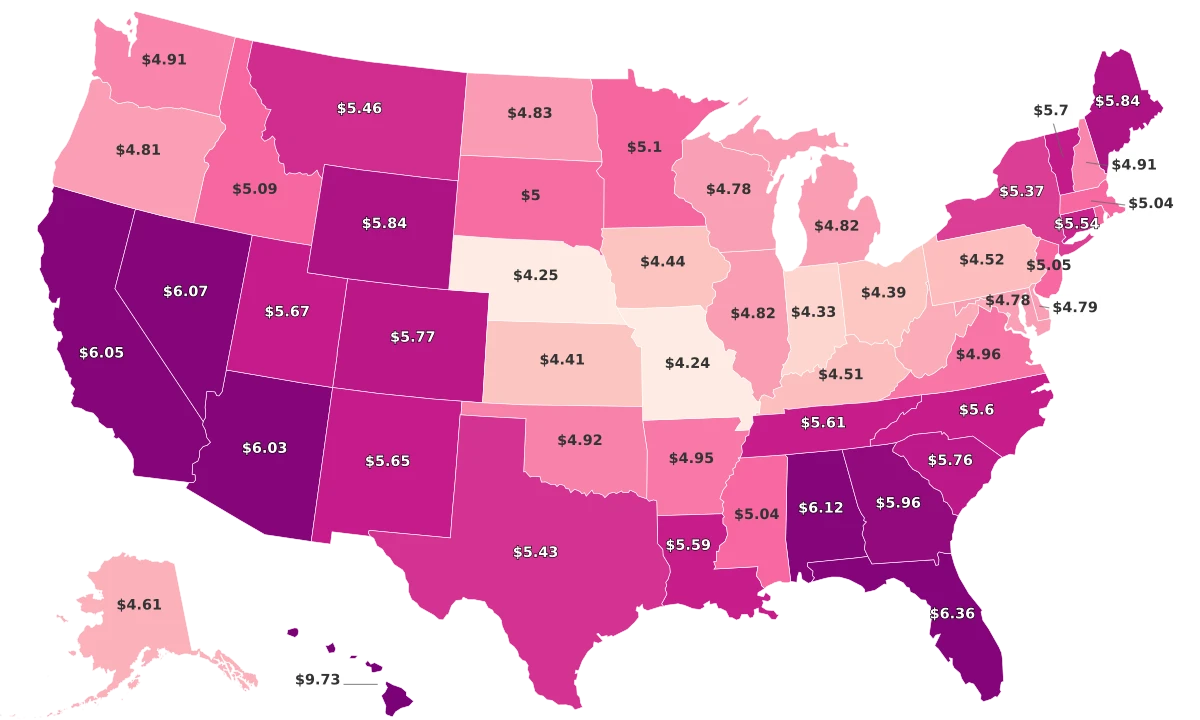
The regional divide is clear. The West averages $59.62 per month, nearly double the Midwest's $30.92. Oregon ($88), Alaska ($87), Washington ($78), and California ($76) all sit well above the national mean. The South ($38.75) and Northeast ($34.44) fall closer to the middle. The cheapest water flows through the Upper Midwest and parts of the rural South: Wisconsin ($21), Vermont ($21), Maine ($22), and Arkansas ($24).
What pushes a state to one end or the other has surprisingly little to do with water availability. The driest states are not always the most expensive. The wettest are not always the cheapest. The biggest driver, as the data shows, is what happens between the treatment plant and your faucet.
West Virginia Pays the Most for Water and Gets Some of the Worst
West Virginia is a statistical outlier. Its $105 average monthly water bill sits more than three standard deviations above the national mean, further from the pack than any other state in the dataset. And the high price does not buy clean water: West Virginia also ranks third in the country for water quality violations, with 8,490 on record.
The roots of the problem are physical. Much of the state's water infrastructure was originally built by coal mining companies in the early 20th century and handed off to small municipal utilities that were never resourced to maintain it. Some pipes in the state's southern coalfields are more than 100 years old. The American Society of Civil Engineers gave West Virginia's drinking water systems a D+ in its 2025 infrastructure report card.
Geography compounds the cost. West Virginia's mountainous terrain makes laying and repairing pipe more expensive per mile than in flatter states. And the state's population has been declining for decades, leaving fewer ratepayers to share the fixed costs of maintaining an aging system. When a utility serving 2,000 homes needs the same pipe replacement as one serving 200,000, the per-household bill goes up fast.
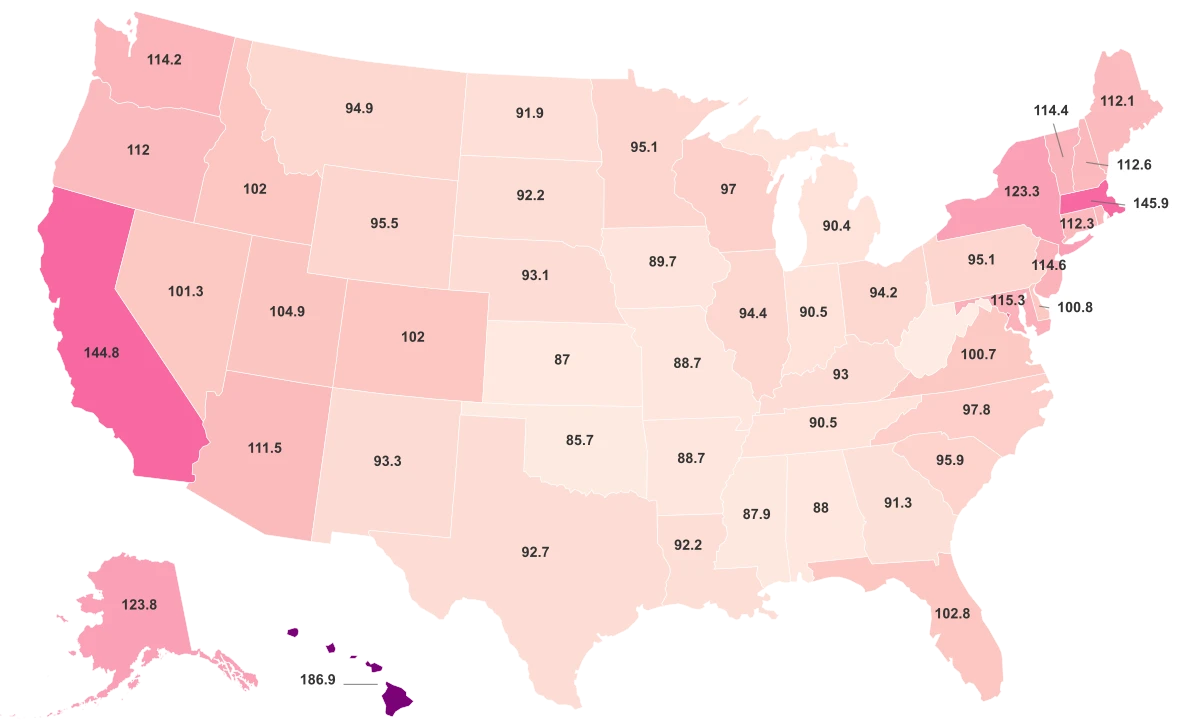
The cruelest part of the math is this: West Virginia has the lowest cost of living index in the entire dataset at 84.1, well below the national baseline of 100. The state where water costs the most is also the state where residents can least afford it.
Expensive Water Does Not Mean Expensive Everything
If water prices tracked the overall cost of living, Hawaii would top the chart. It has the highest cost of living index in the country at 186.9, nearly double the national average. But Hawaii's water bill is $64 per month, placing it eighth. New York, with a cost of living of 123.3, pays just $30 per month, less than the national median. California (COL 144.8) pays $76. Massachusetts (COL 145.9) pays $33.
The relationship between water bills and cost of living is weak. The two metrics show almost no meaningful connection across all 50 states.
Water Bills Have Little to Do With the Cost of Living
Average Monthly Water Bill vs. Cost of Living Index across all 50 states. West Virginia anchors the bottom-right corner: cheapest state to live in, most expensive water.
What does drive water prices is infrastructure. Oregon ($88/month) is not an especially expensive state to live in, with a cost of living index of 112. But Portland is in the middle of a multimillion-dollar water filtration plant project, and the League of Oregon Cities has documented rate increases across the majority of the state's municipalities. Alaska ($87) faces a different version of the same problem: building and maintaining water systems on permafrost in remote communities costs several times what it costs in the lower 48.
The states with the cheapest water tend to share two things: large, centralized utility systems that spread costs across dense customer bases, and infrastructure young enough to avoid constant emergency repairs. North Carolina ($20), Wisconsin ($21), and Illinois ($26) all fit that profile. None of them has a water scarcity problem, and none is bleeding ratepayers to replace century-old pipe.
The Violation Count Reflects How Many Systems a State Has, Not How Clean Its Water Is
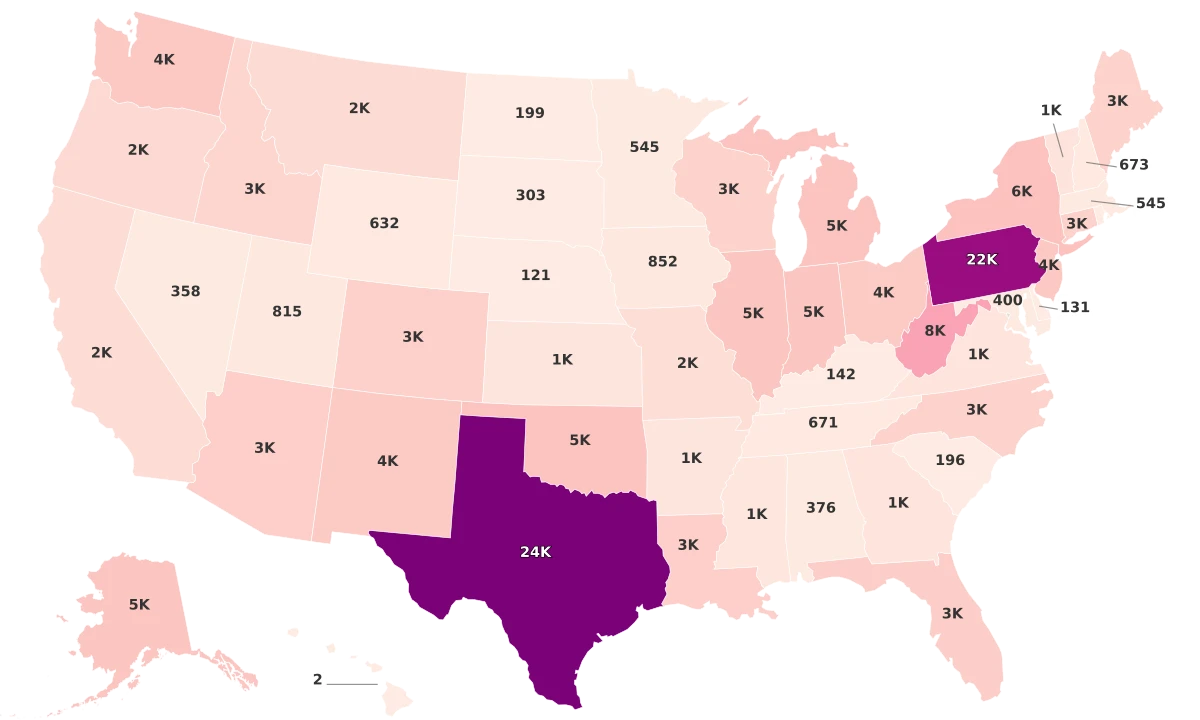
Texas leads the country with 23,628 water quality violations, more than double the next-closest state. Pennsylvania follows at 21,527. Together, those two states account for roughly 30% of all violations in the dataset. The top five states, which add West Virginia (8,490), New York (5,607), and Oklahoma (5,379), hold nearly 44% of the national total.
Those numbers look alarming until you consider what they are actually counting. Water quality violations are reported under the federal Safe Drinking Water Act each time a water system fails to meet a standard: a missed test, a contaminant exceedance, or a procedural failure. Texas has more than 7,000 public water systems. Pennsylvania has more than 8,000. Many are tiny, serving a few hundred people, and small systems are disproportionately likely to report violations because they lack the staff, equipment, and budgets to stay in full compliance.
At the other end, Hawaii has just 2 violations across the entire state. Nebraska has 121. Delaware has 131. These are not necessarily states with cleaner water. They are states with fewer, larger, and better-resourced systems. A single violation in a small rural water district counts the same as a violation in a system serving millions.
The violations metric shows no meaningful relationship with water bills or cost of living. A state can have thousands of violations and cheap water (Texas: $45/month, 23,628 violations), or almost none and expensive water (Alaska: $87/month, 4,650 violations). What the violations map really shows is where the patchwork of American water infrastructure is most fragmented, and that is a function of how many small utilities a state relies on, not how safe the tap water is.