Europe's Wealth Gap Runs Nearly 8-to-1
The International Monetary Fund measures economic output per person using GDP per capita adjusted for purchasing power parity, a metric that accounts for cost-of-living differences between countries. Instead of converting everything to US dollars at volatile market exchange rates, the IMF uses standardized price surveys to estimate what a dollar actually buys in each country. The result is one of the most widely used measures of average prosperity.
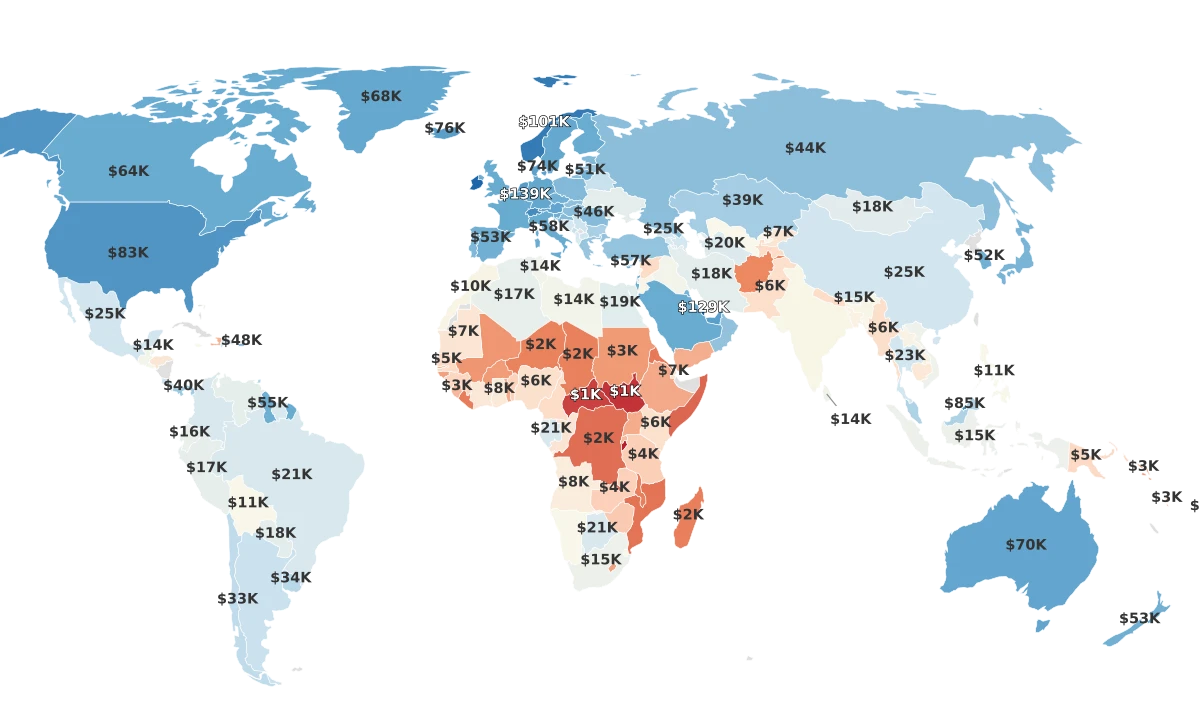
Across the 41 European countries in this ranking, the 2023 data reveals a gap that would surprise most people. Luxembourg leads at $139,466 per person. Moldova, at the bottom, sits at $17,597. That is a ratio of nearly 8-to-1 within a single continent, a wider gap than most people associate with Europe.
The top of the ranking is dominated by small, wealthy Western and Northern European economies: Luxembourg, Ireland ($124,901), Norway ($100,928), and Switzerland ($89,546). The divide tracks geography almost perfectly: Western and Northern Europe sit above $60,000, while Southern Europe clusters in the $40,000 to $58,000 range.
The bottom tells a different story. Ukraine ($17,630), Albania ($21,263), and Bosnia and Herzegovina ($22,449) all fall below $25,000. North Macedonia ($24,391) and Serbia ($28,749) sit just above that threshold. Every country below $30,000 is either a Western Balkan state or a former Soviet republic.
Most of the continent clusters in the upper half. The median is $53,230, but the mean is $56,332, pulled upward by a handful of extremely wealthy outliers at the top. That skew is the first signal that the numbers at the very top of this ranking deserve closer examination.
The Two Richest Countries on Paper May Not Actually Be the Richest
Luxembourg and Ireland are the only two statistical outliers in the entire dataset, sitting more than 2.5 standard deviations above the European mean. Their combined GDP per capita figures are so high they distort the continental average. But both numbers are famous among economists for measuring something other than what residents actually experience.
Luxembourg's figure is inflated by roughly 200,000 cross-border commuters who travel in from France, Germany, and Belgium each workday. These workers contribute to Luxembourg's GDP, generating economic output that counts in the numerator. But they live abroad and are not counted in the population denominator. The result is a GDP per capita figure that overstates the average resident's prosperity. According to Eurostat's Actual Individual Consumption data, which measures what households actually consume, Luxembourg drops well below its GDP ranking.
Ireland's distortion comes from a different source. Multinational corporations, particularly American tech and pharmaceutical firms, hold intellectual property rights in Ireland because of its favorable corporate tax structure. Revenue from the global use of those patents is booked as Irish GDP, creating what former Irish Central Bank Governor Paul Lane called "leprechaun economics." In 2015, Ireland's GDP appeared to grow by 26% in a single year, a figure so absurd that Ireland's own Central Statistics Office created a new metric, Modified Gross National Income (GNI*), specifically to strip out these distortions.
None of this means Luxembourg and Ireland are poor. Both are genuinely wealthy countries with high living standards. But their positions at the top of a GDP per capita ranking tell you more about corporate accounting and labor market geography than about how their residents actually live.
Why the Bottom of the Ranking Has Barely Moved in 30 Years
The six poorest countries in this ranking, Moldova, Ukraine, Albania, Bosnia and Herzegovina, North Macedonia, and Serbia, share a set of structural barriers that have kept them at the bottom of European wealth tables since the 1990s.
The most fundamental is the unfinished transition from central planning to market economies. More than three decades after the collapse of the Soviet Union and Yugoslavia, these countries still struggle with weak rule of law, fragmented governance, and public sectors that crowd out private enterprise. Bosnia and Herzegovina operates under the Dayton Agreement signed in 1995, which created a dual-entity political structure so complex that even routine economic reforms require consensus across multiple layers of government. That institutional friction has deterred foreign investment for decades.
Brain drain compounds the problem. Young, skilled workers leave for EU member states where wages are multiples of what they can earn at home. The departure hollows out domestic labor markets and makes it harder for these economies to shift toward higher-value industries. Combined with low fertility rates, the result is a demographic squeeze that puts growing pressure on pension systems and shrinks the tax base.
The European Commission introduced a €6 billion Reform and Growth Facility in November 2023 specifically to accelerate convergence for the Western Balkans. The region currently sits at roughly 40% of the EU average GDP per capita. According to OECD projections, at current growth rates, these countries would not reach EU-average income levels until approximately 2074, half a century away. Ukraine, whose economy was devastated by Russia's full-scale invasion in 2022, faces an even steeper climb: its GDP per capita PPP grew just 13.44% between 2020 and 2023, the slowest rate of any country in the dataset.
Germany Lost Four Spots. The Whole Continent Is Reshuffling.
Between 2020 and 2023, Europe's GDP per capita rose by an average of 26.84% in PPP terms. But that continental average hides a dramatic reshuffling. Some countries surged far beyond the pack. Others, including some of Western Europe's largest economies, fell behind.
Norway recorded the single largest absolute gain, jumping from $67,111 to $100,928, a 50% increase driven largely by soaring energy revenues after natural gas prices spiked following Russia's invasion of Ukraine. Iceland climbed 5 rank positions, fueled by a tourism boom and a strong krona. San Marino and Andorra each climbed 5 spots as well, small economies benefiting from broader post-COVID recovery.
Post-COVID Europe Split Into Winners and Losers
GDP Per Capita PPP change from 2020 to 2023. Norway surged on energy revenues while Germany's industrial model stalled.
The other side of that reshuffling is more striking. Germany fell from 7th to 11th, a drop of 4 positions. Its GDP per capita grew roughly 18% over the period, well below the continental average. The loss of cheap Russian natural gas after 2022 hit Germany's energy-intensive industrial base hard, raising costs for manufacturers across the automotive, chemical, and steel sectors. Sweden fell 4 spots as well, from 9th to 13th. Czech Republic dropped from 18th to 22nd.
The pattern is not random. The countries that lost ground tend to be mid-sized industrial economies exposed to energy price shocks and global supply chain disruptions. The countries that gained tend to be either energy exporters (Norway), tourism-driven small economies (Iceland, Andorra), or post-COVID rebounds in Southern and Eastern Europe where the base was lower and the recovery sharper.