Native American population in the United States
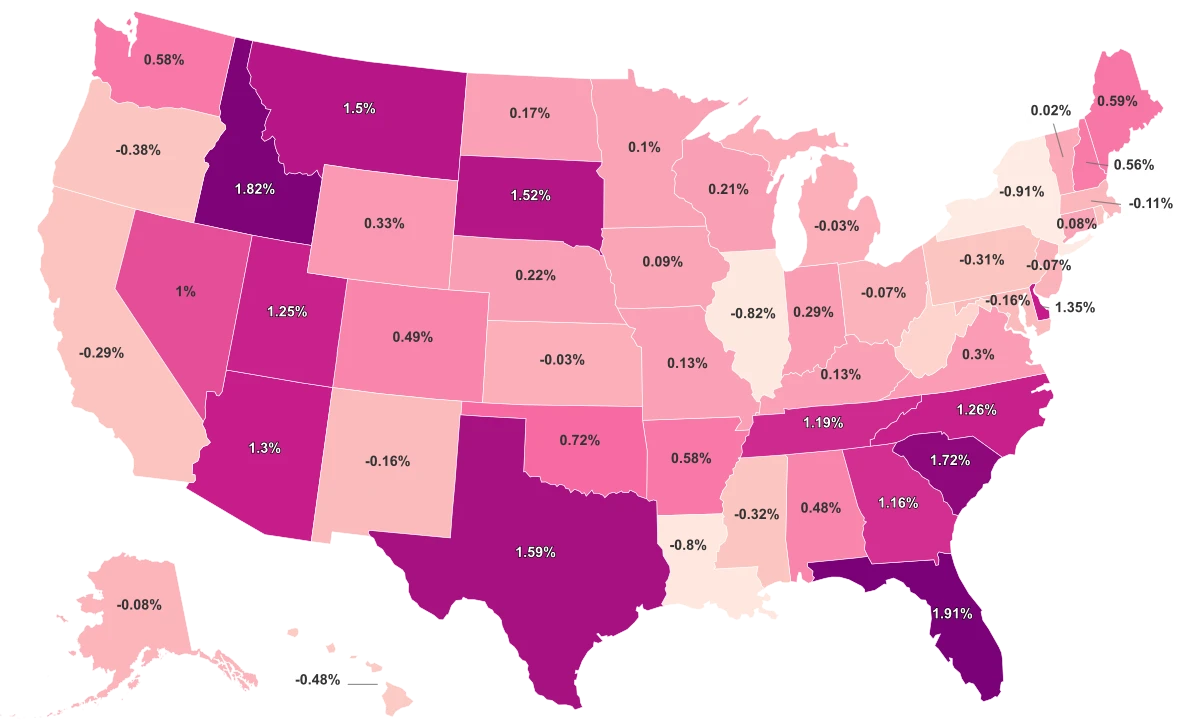
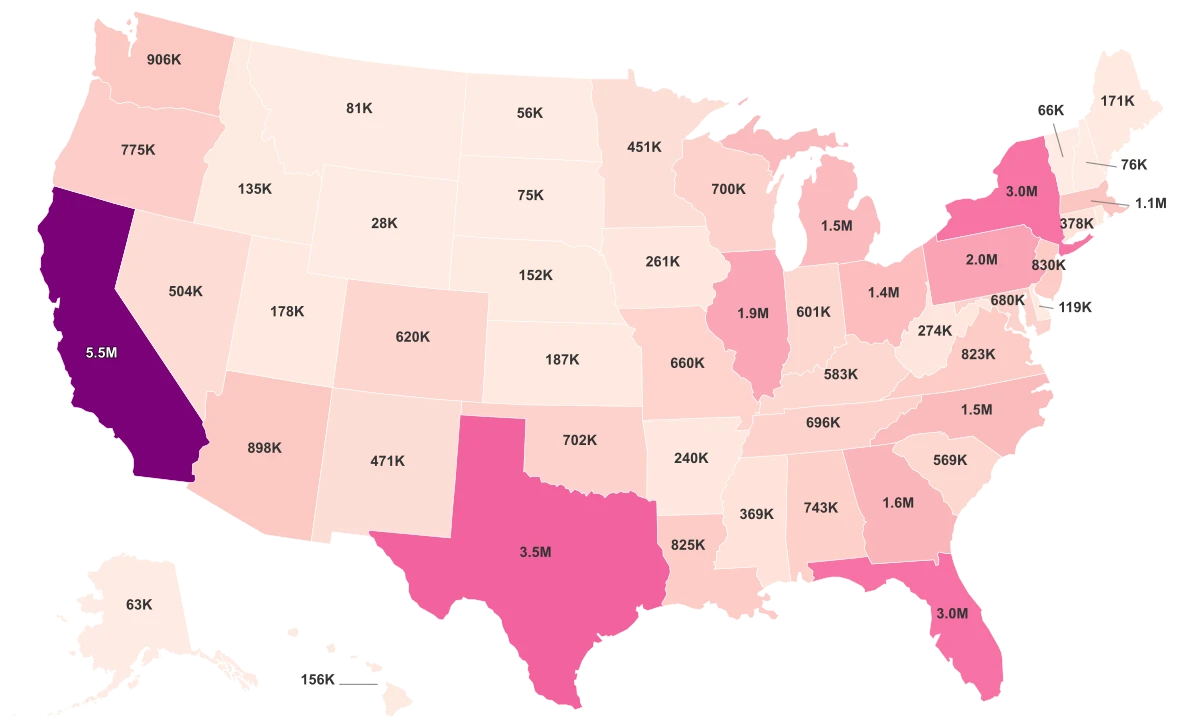
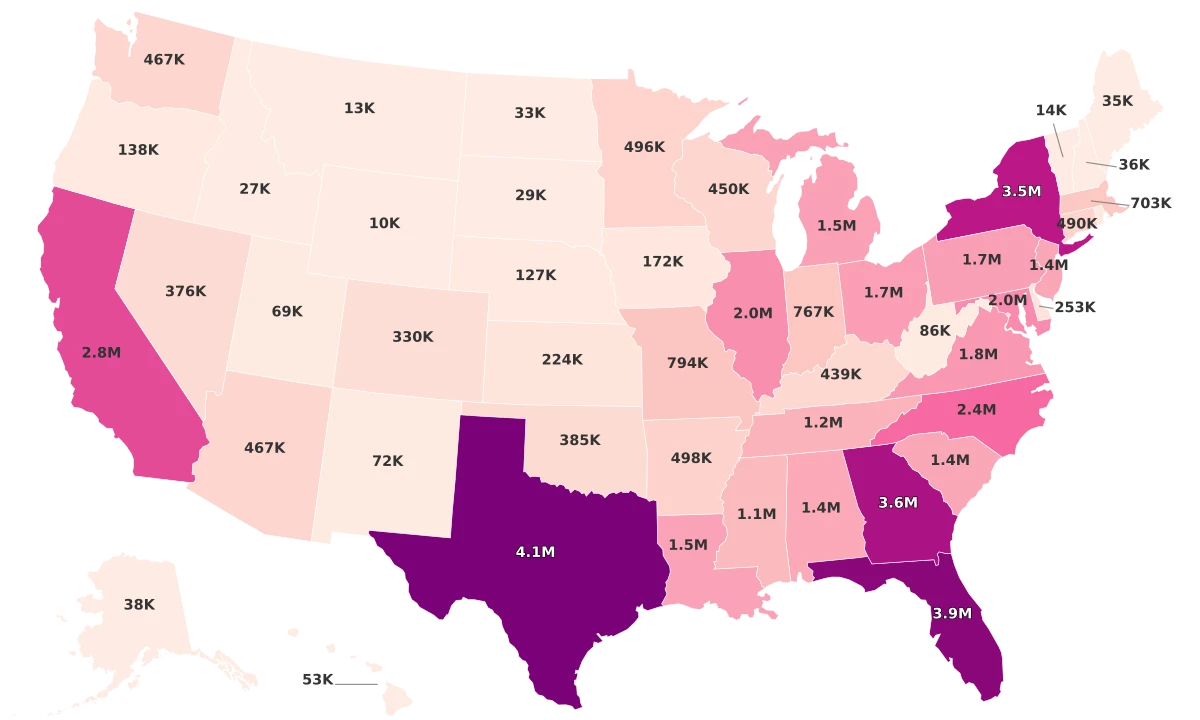
The Native American population in the United States reflects both the country’s demographic scale and its deep Indigenous roots. Based on 2023 Census estimates, over 6.8 million people identify as American Indian or Alaska Native, either alone or in combination — an 11 % increase from the previous decade. While Native Americans represent a small share of the U.S. population, they form the majority in specific regions and remain culturally and politically significant across the country.
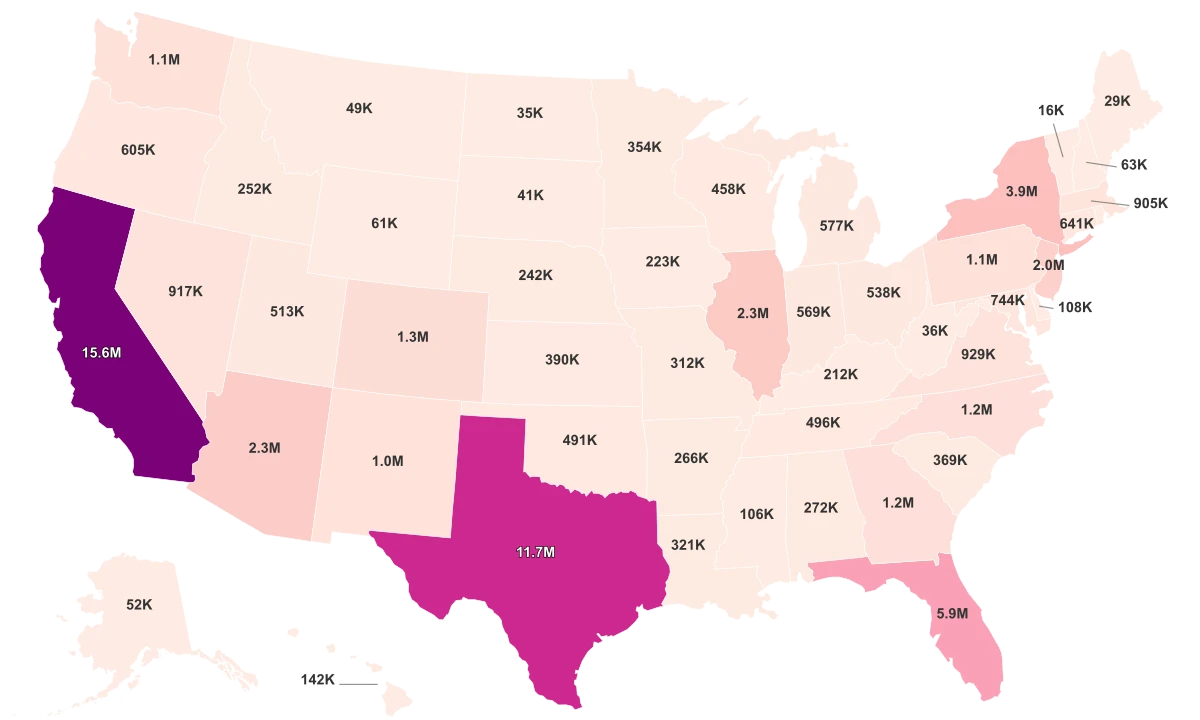
The data reveal clear regional patterns. Large states lead by total count, such as California and Texas, while others — particularly Oklahoma, Alaska, and New Mexico — show high concentrations relative to population size. These patterns trace back to the presence of major tribal lands and historical relocations under U.S. policy.
Key Findings
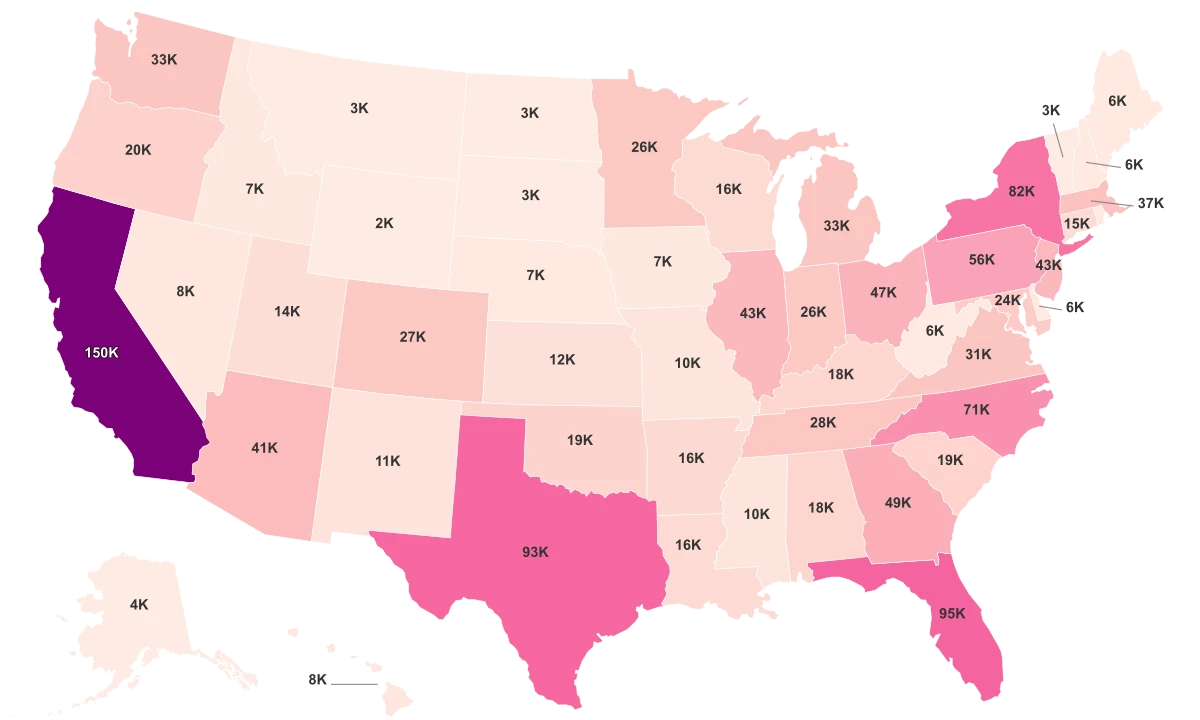
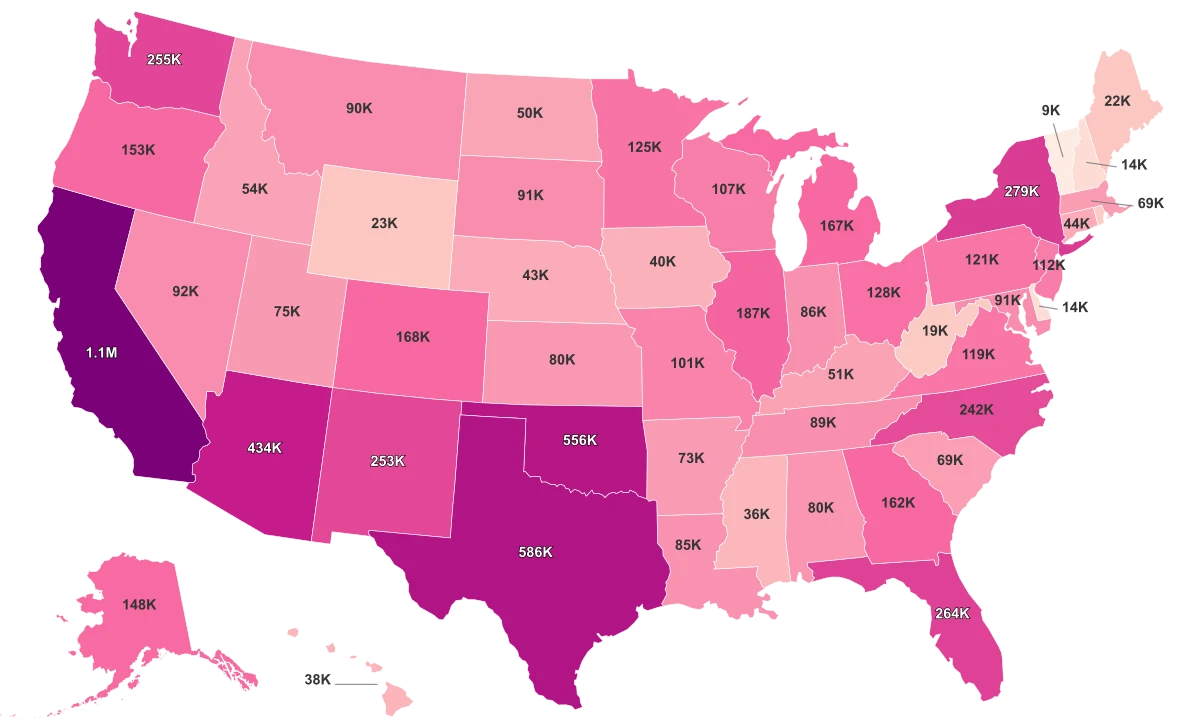
- California has the largest Native American population, exceeding 1.1 million, with major communities in Los Angeles, San Diego, and the Central Valley.
- Texas ranks second, with about 586 000 Native Americans, mostly in urban areas rather than reservations.
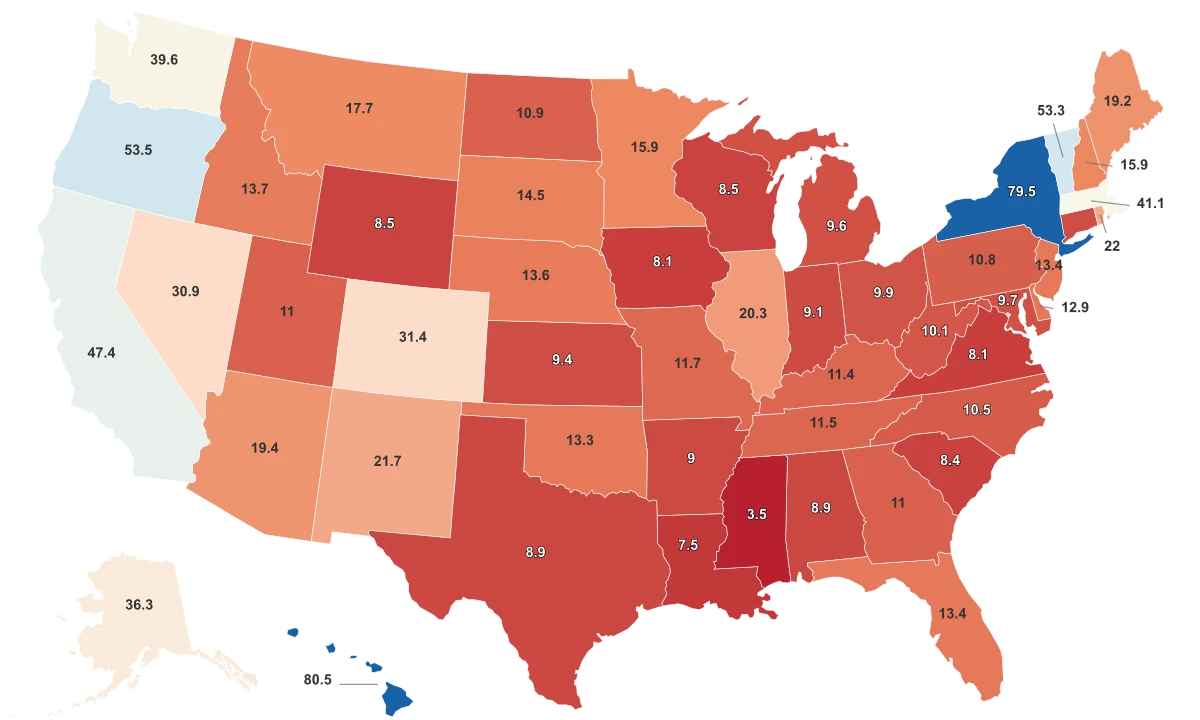
- Oklahoma and New Mexico combine both large numbers and high shares — 13.5 % and 11.8 %, respectively — among the strongest Indigenous presences in the nation.
- Alaska stands out with only 148 000 Native Americans but nearly 20 % of the state’s total population, the highest concentration nationally.
- Eastern states such as Vermont and Delaware record the smallest counts, though they maintain recognized tribes and Indigenous communities despite limited numbers.
States with the Largest Native American Populations
- California — Home to over 100 federally recognized tribes, it has the largest Native American population in the U.S. Despite its size, Native Americans account for less than 3 % of residents, concentrated in both tribal lands and major cities.
- Texas — Ranking second, Texas’s Native population is largely urban and multi-tribal, reflecting migration rather than historical tribal concentration.
- Oklahoma — With 39 federally recognized tribes, Oklahoma combines a large absolute number and one of the country’s highest Indigenous shares (13.5 %), reflecting its role as a center of Native sovereignty.
- Arizona — The Navajo, Hopi, and Apache nations make Arizona one of the most visibly Indigenous states, where reservations cover significant portions of land.
- New York — About 279 000 residents identify as Native American, primarily from the Haudenosaunee (Iroquois) Confederacy and growing urban communities in New York City.
- Florida — Home to the Seminole and Miccosukee tribes, Florida’s Indigenous population is mostly urban and diverse, with concentrations in South Florida.
- Washington — With 29 federally recognized tribes, including the Puyallup, Yakama, and Lummi, Washington maintains a strong Indigenous presence along the coast and Puget Sound.
- New Mexico — Native Americans make up about 12 % of the population, primarily Pueblo, Navajo, and Apache peoples — one of the highest shares in the continental U.S.
- North Carolina — The Lumbee Tribe anchors the state’s Indigenous population, the largest east of the Mississippi, mainly in Robeson County.
- Georgia — Georgia’s Native American population reflects Cherokee descendants and growing multi-tribal communities around Atlanta.
| State | Native American Population (2023) | Share of Population |
|---|---|---|
| California | 1,110,000 | 2.8 % |
| Texas | 586,000 | 1.8 % |
| Oklahoma | 556,000 | 13.5 % |
| Arizona | 434,000 | 5.7 % |
| New York | 279,000 | 1.4 % |
| Florida | 264,000 | 1.1 % |
| Washington | 255,000 | 3.2 % |
| New Mexico | 253,000 | 11.8 % |
| North Carolina | 242,000 | 2.2 % |
| Georgia | 162,000 | 1.4 % |
States with the Smallest Native American Populations
Vermont — The smallest Native American population nationally (~9 000) but home to state-recognized Abenaki tribes.
District of Columbia — A small, urban-based Indigenous population from diverse tribal origins.
Delaware — Despite its modest count, about 1.3 % of residents identify as Native American, primarily from the Nanticoke and Lenape tribes.
New Hampshire — Minimal tribal representation, with small Native communities integrated into broader regional populations.
Maine — The Penobscot and Passamaquoddy nations maintain active cultural and territorial presence despite small numbers.
Wyoming — Though total count is low, nearly 4 % of residents identify as Native American, mainly from the Eastern Shoshone and Northern Arapaho tribes.
Rhode Island — The Narragansett Tribe represents the core of the state’s Native population.
West Virginia — Indigenous residents are dispersed and largely urban, with few organized tribal structures.
Nebraska — Several reservations exist despite moderate totals, including the Omaha and Winnebago tribes.
Connecticut — Home to the federally recognized Mohegan and Mashantucket Pequot tribes, known for their economic and cultural contributions.
| State | Native American Population | Share of Population |
|---|---|---|
| Vermont | 9,300 | 1.4 % |
| District of Columbia | 10,700 | 1.5 % |
| Delaware | 13,600 | 1.3 % |
| New Hampshire | 13,800 | 1.0 % |
| Maine | 22,200 | 1.6 % |
| Wyoming | 22,500 | 3.8 % |
| Rhode Island | 18,500 | 1.6 % |
| West Virginia | 19,000 | 1.1 % |
| Nebraska | 43,400 | 2.1 % |
| Connecticut | 44,200 | 1.2 % |