Pride Across America's Cities
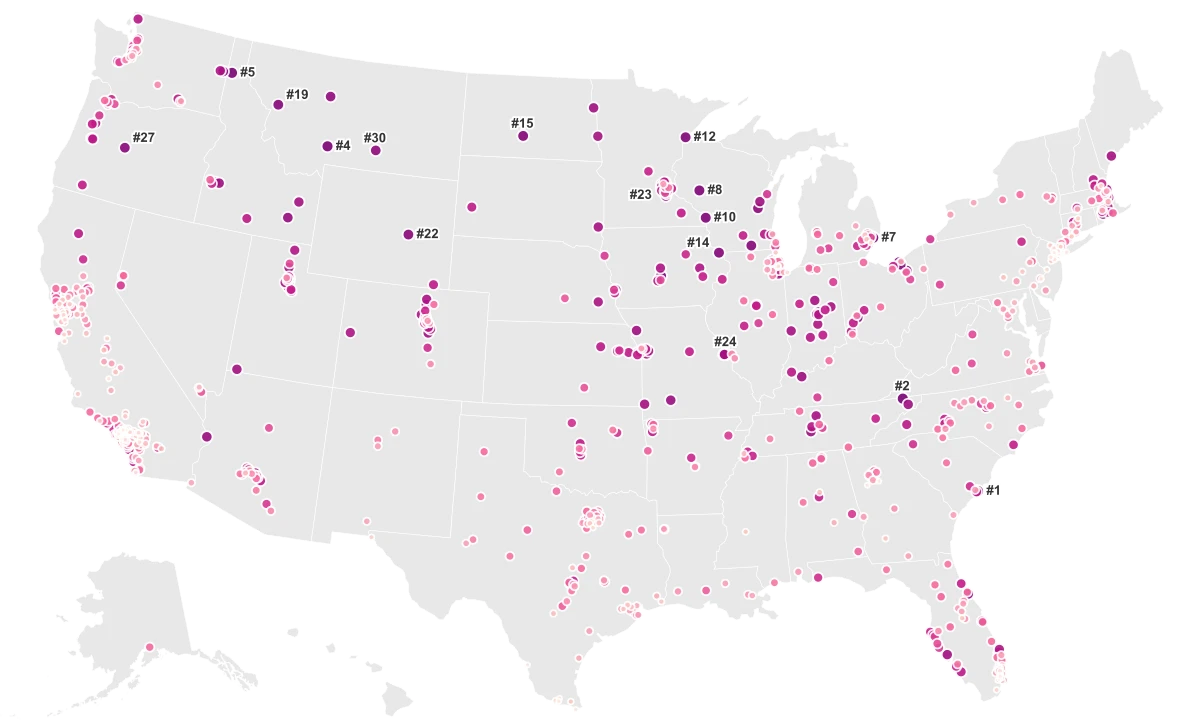
America's landscape changes as we traverse her breadth. From coast to coast, our beautiful nation is embellished with cities that paint a spectrum of diversity, acceptance, and inclusivity. The spectrum of our cultural palette perhaps shines the brightest when viewed through the prism of our LGBTQ+ community. In the wake of the historical Supreme Court ruling (Obergefell v. Hodges, 2015), every state now recognizes same-sex marriages, thereby taking leaps towards equality. However, the cultural acceptance and size of the LGBTQ+ community differ significantly across American cities. What makes a city 'gay-friendly' isn't just the ability to get married but also the cultural acceptance and size of the local LGBTQ+ community. We have determined the 'gayest' cities based on the highest percentage of self-identified LGBTQ+ individuals.
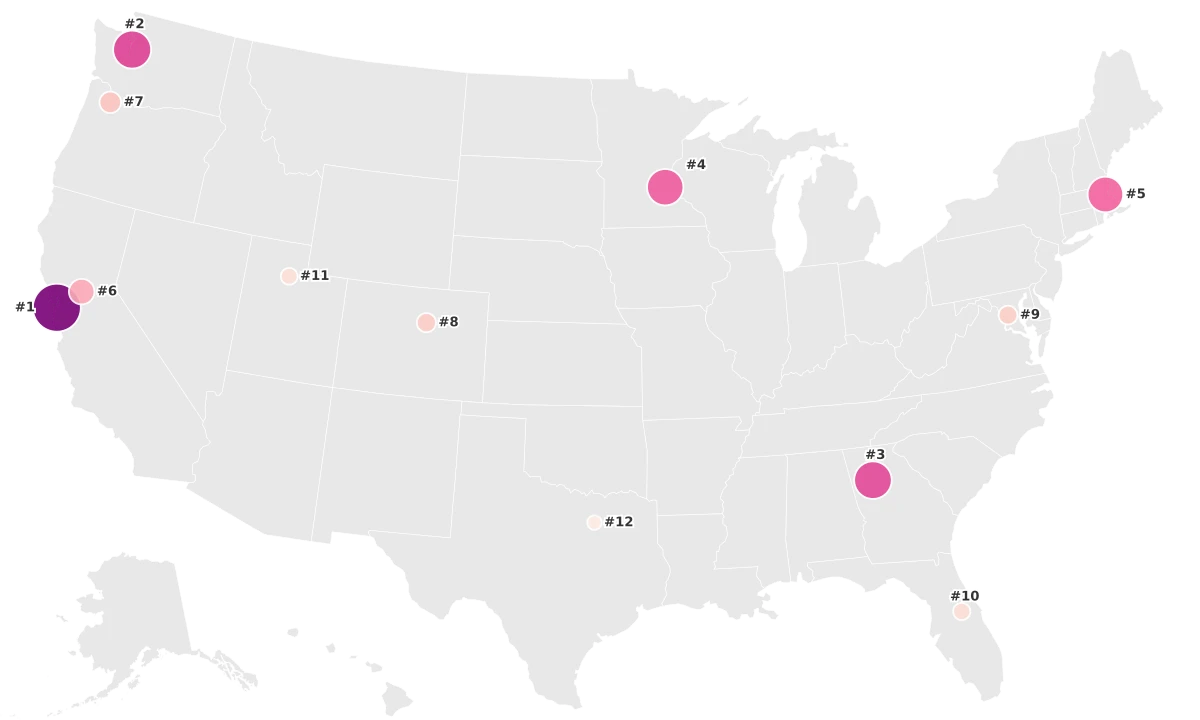
- San Francisco stands out as the city with the highest LGBTQ+ population, with 15.4% of its residents identifying as part of this community. A beacon of pride since the Stonewall riots, San Francisco has long been a city that champions diversity, encouraging generations of LGBTQ+ individuals to call it home.
- The West Coast shines brightly in LGBTQ+ inclusivity, with four of the top seven cities based here, including San Francisco, Seattle, Sacramento, and Portland. The atmosphere of acceptance and freedom has cultivated a nurturing environment for the LGBTQ+ community in these cities.
- Cities in the heartland, like Minneapolis and Denver, also boast high percentages of LGBTQ+ residents, painting a picture of inclusivity that spans across the nation.
- A notable mention goes out to Salt Lake City, Utah. It surprisingly boasts a substantial LGBTQ+ population for a city situated in a rather conservative state.