Examining Density Across the U.S.
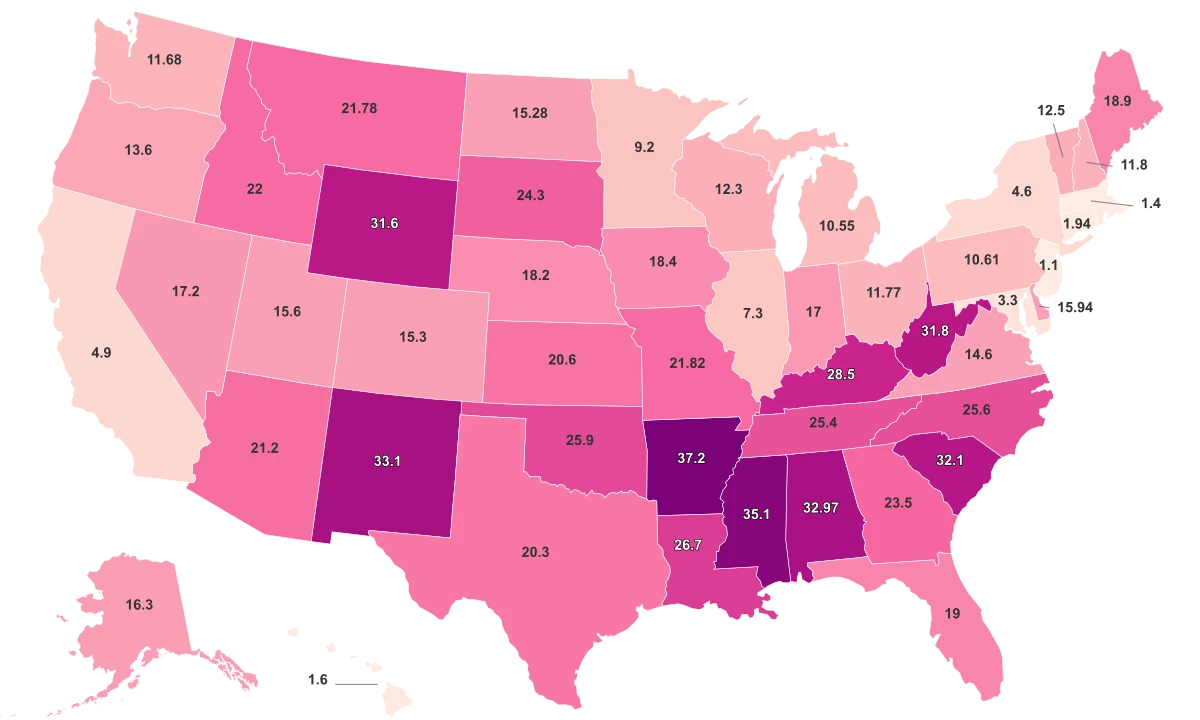
The relationship between population density and both social and economic outcomes is a complex interplay of numerous factors. Population density, defined as the number of people per square mile, varies tremendously across the United States.
High population densities, such as those seen in the cities and suburbs of the eastern seaboard, spur bustling economic and social environments and foster the sort of environments synonymous with words like 'cosmopolitan' and 'urban.' However, these come with their own challenges like inflated housing costs, heightened pollution, and pressure on existing resources. On the opposite end, lower densities can offer serene landscapes and close-knit communities, but can also present challenges related to economic development and risk isolation on multiple fronts.
Key findings from the data include:
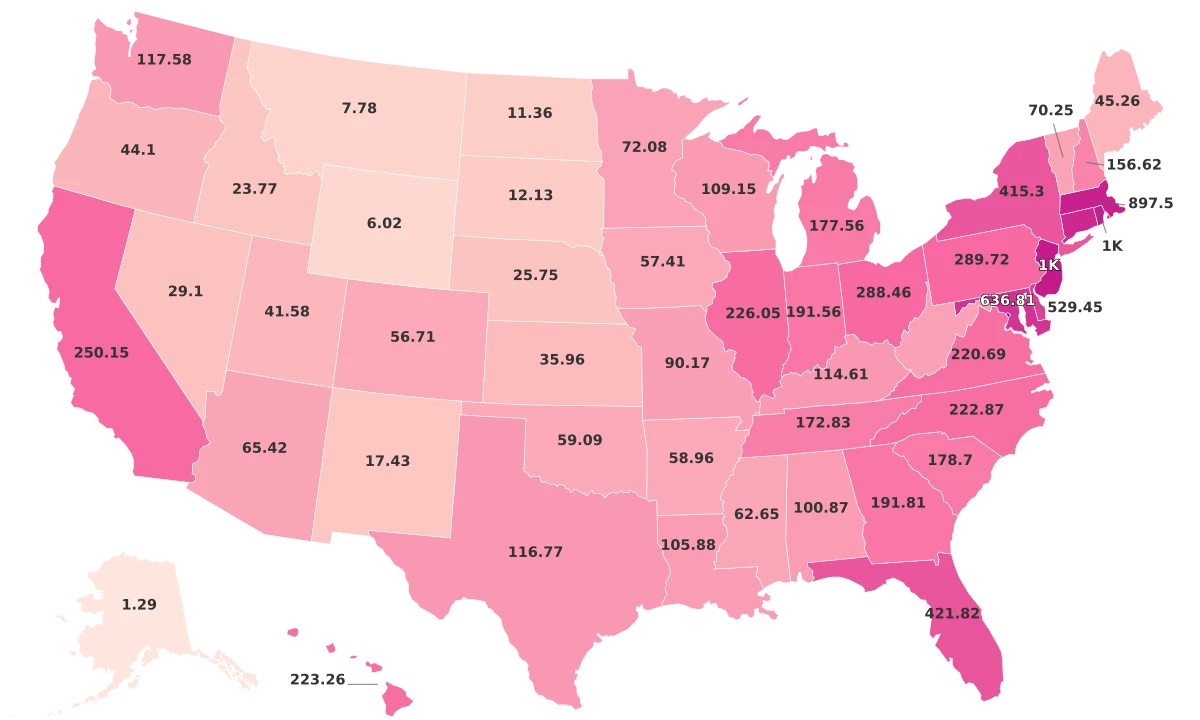
- The states with the highest population densities are all located in the Northeast region of the U.S., with New Jersey (1,259 residents per square mile), Rhode Island (1,055), Massachusetts (894), Connecticut (749), and Maryland (634) at the top. These states represent a vibrant mix of urban and suburban communities with advanced economies.
- Florida has the highest density among southern states with 423 residents per square mile, making it an interesting case in terms of regional disparity within the Southern United States.
- On the lower end of the density scale, the states of the Mountain West and Great Plains regions dominate, including Wyoming (6 residents per square mile), Montana (8), North Dakota (11), and South Dakota (12). These low-density areas represent the rural heartland of America, often associated with agriculture and natural resources.
- Alaska showcases an extreme example of low population density with a stark 1 resident per square mile. With its vast wilderness and limited infrastructure, Alaska’s unique circumstances illuminate the challenges of low-density living.
Most Dense States
The states lining the Atlantic coast dominate in terms of population density, with five northeastern states claiming the top spots. Interestingly, these states are relatively small in terms of total land area but packed with people, hence their high population densities.
At the apex of the list is New Jersey, with the highest density of 1,259 residents per square mile. Known for its strong economy, diverse population, and proximity to major cities like New York City and Philadelphia, it's not surprising it holds the number one spot.
Not far behind is Rhode Island, embodying the phrase "small but mighty." Despite its limited size, Rhode Island has a density of 1,055 residents per square mile, consolidating its position as the second most densely populated state.
Next in line is Massachusetts, with a population density of 894. Rooted in its rich history and bolstered by the economic and social powerhouses of Boston and Cambridge, Massachusetts continues to draw in residents, increasing its sizable population density.
Following closely is Connecticut, with a density of 749 residents per square mile. As one of the original 13 colonies, Connecticut has long been a favored destination for those seeking a mix of urban life, picturesque landscapes, and maritime charm.
Rounding out the top five, Maryland packs 634 people into each square mile, highlighting the popularity and economic draw of this mid-east coast state.
Beyond the northeast, Delaware, positioned at sixth with a 529 population density, and Florida, standing at seventh with 423 residents per square mile, are notable for their density amidst their more sparsely populated regional counterparts.
The list is concluded by New York with 414 residents per square mile, Pennsylvania with 289, and Ohio with 288 residents per square mile.
Most Dense States:
- New Jersey - 1,259 residents/mi²
- Rhode Island - 1,055 residents/mi²
- Massachusetts - 894 residents/mi²
- Connecticut - 749 residents/mi²
- Maryland - 634 residents/mi²
- Delaware - 529 residents/mi²
- Florida - 423 residents/mi²
- New York - 414 residents/mi²
- Pennsylvania - 289 residents/mi²
- Ohio - 288 residents/mi²
Least Dense States
At the very bottom of the density scale is Alaska. Despite its massive geographical area, its population is notably sparse, with a density of just a single resident per square mile. Alaska's unique environment and remote location lead to it having the lowest population density in the United States.
Following Alaska is Wyoming, with six residents per square mile. Known for its wide-open plains and stunning mountain views, Wyoming provides a stark contrast in density compared to states like New Jersey.
Montana, North Dakota, and South Dakota, with densities of 8, 11, and 12 residents per square mile respectively, primarily comprise rural residences and farmland. These states, in the heart of America's agricultural regions, are characterized by small towns interspersed within vast tracts of land.
Continuing in this trend, we see New Mexico, Idaho, Nebraska, Nevada, and Kansas with densities ranging from 17 to 36 residents per square mile. Be it New Mexico's desert expanses, Idaho's forested mountain ranges, Nebraska's open prairies, Nevada's remote desert cities, or Kansas's rolling plains, each of these states stands testament to America's vast rural landscape.
Least Dense States:
- Alaska - 1 resident per square mile
- Wyoming - 6 residents per square mile
- Montana - 8 residents per square mile
- North Dakota - 11 residents per square mile
- South Dakota - 12 residents per square mile
- New Mexico - 17 residents per square mile
- Idaho - 24 residents per square mile
- Nebraska - 26 residents per square mile
- Nevada - 29 residents per square mile
- Kansas - 36 residents per square mile