The Gap Between the Best and Worst Education Systems Spans Seven Years of Learning
Every three years, the OECD tests 15-year-olds around the world on their ability to solve real problems in math, reading, and science. The test is called PISA, the Programme for International Student Assessment, and the 2022 cycle covered 81 countries with roughly 690,000 students. Scores are scaled so that the OECD average sits at approximately 500. A 30-point gap between two countries translates to about one year of schooling.
The range in the 2022 results is staggering. Singapore leads at 560, the only country more than two standard deviations above the mean. Cambodia anchors the bottom at 337. The gap between them is 223 points, the equivalent of roughly seven and a half years of schooling. Between those extremes, the data sorts into tiers: a cluster of East Asian systems at the top, a broad European and Anglophone middle hovering near the OECD baseline, and a group of lower-income countries in Latin America, Southeast Asia, and the Middle East at the bottom.
The 2022 results also captured something new: the first global measurement of COVID's impact on learning. Across all participating countries, the average math score fell by roughly 15 points compared to 2018, the largest single-cycle decline in PISA history. Reading dropped by about 10.
The damage was wildly uneven. Jordan fell 57 points. Albania lost 53. Meanwhile, Taiwan gained 16 and Japan added 13. The OECD noted that school closure duration alone did not predict which countries declined the most, suggesting the pandemic amplified structural weaknesses that already existed.
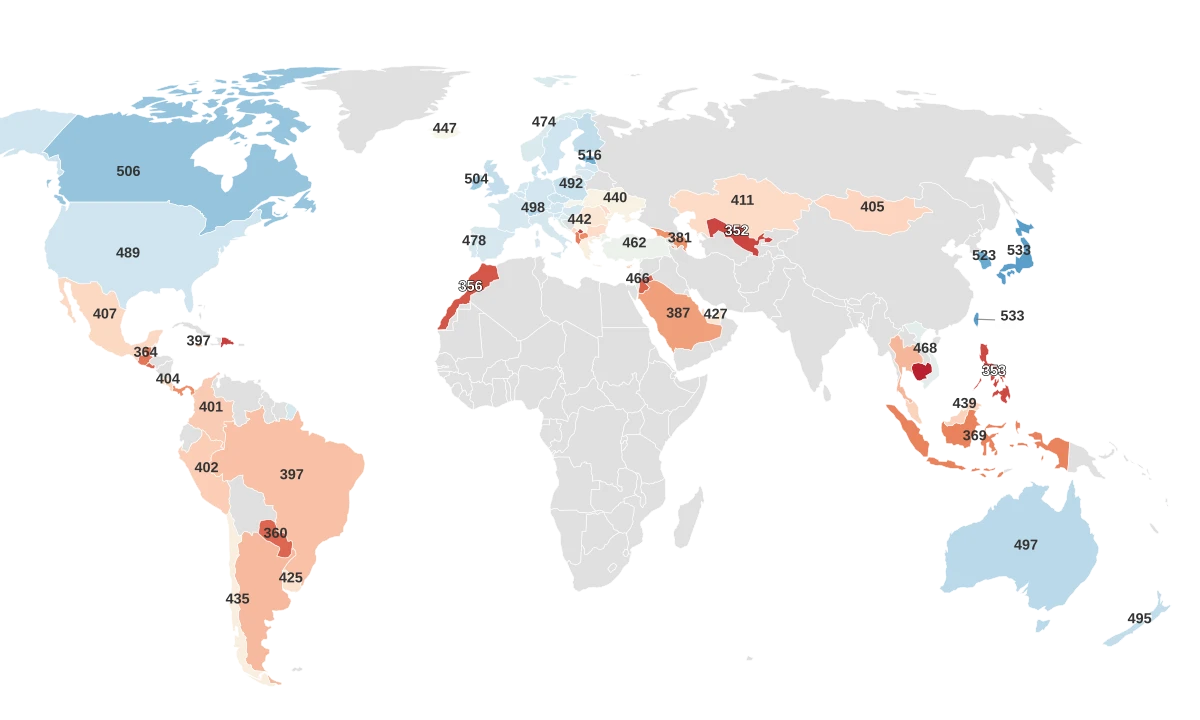
Most Countries Lost Ground After COVID, but a Few Gained
Overall PISA Score change from 2018 to 2022. Taiwan, Japan, and the Dominican Republic improved while most of the world declined.
Showing 51 of 68 regions · Sorted by: Highest to Lowest · 17 not shown
What Singapore Does That Wealthy Countries Cannot Buy
Singapore scored 560 on the overall assessment, 25 points clear of second-place Macau. In math specifically, Singapore's score of 575 is the highest any country has achieved in any single PISA domain. According to the OECD, Singaporean 15-year-olds are the equivalent of three to five years of schooling ahead of their global peers. The one system that outscored Singapore in 2018, China (testing only four provinces: Beijing, Shanghai, Jiangsu, and Zhejiang, which scored 578.7), could not collect data in 2022 because COVID school closures shut down testing during the assessment window.
The numbers go deeper than the average. Ninety-two percent of Singaporean students reached at least Level 2 proficiency in math, compared to the OECD average of 69%. Forty-one percent were top performers, scoring at Level 5 or 6. The OECD average for that tier is 9%. Singapore also produced the highest proportion of "academic all-rounders," students who scored in the top band across all three subjects simultaneously.
The most revealing comparison is not Singapore versus Cambodia. It is Singapore versus the countries that spend more and get less. Qatar scored 422. The United Arab Emirates scored 427. Both are among the wealthiest countries on Earth per capita. Both sit well below the OECD average. Vietnam, a country with a fraction of their education budgets, scored 468.
Singapore's Ministry of Education credits a mastery-based math curriculum where students must demonstrate competence on each concept before advancing, paired with a "spiral" design that revisits foundational ideas at increasing depth. Teachers are trained through the National Institute of Education, with the government covering full tuition in exchange for a three-year teaching commitment. The approach prioritizes applied problem-solving over rote memorization. Even students in Singapore's bottom socioeconomic quartile score above the overall OECD average. No other country in the dataset can make that claim.
Finland Was the Model. Sixteen Years Later, It Is Still Falling.
For a generation of education reformers, Finland was the answer. The country topped the first PISA rankings in 2000 and held a top-five position through 2006. Its formula seemed clear: highly trained teachers, minimal standardized testing, no tracking of students into ability groups, and a commitment to equity that made family income nearly irrelevant to school performance.
The 2022 results show a different trajectory. Finland scored 495, a 21-point decline from its 2018 score of 516.3. The fall has been continuous. Finland has dropped in every PISA cycle since its peak. It now sits behind Canada (506), Ireland (504), and most notably, Estonia (516), a neighbor that adopted many Finnish principles while avoiding Finland's recent missteps.
What changed? The Finnish National Agency for Education has acknowledged the trend. A 2016 national curriculum reform shifted schools toward greater student autonomy and self-directed learning. That approach appears to work for strong students but leaves weaker ones without enough structure. Open-plan classroom layouts have been linked to increased distraction. Forty-one percent of Finnish students reported that other students' device use in class disrupted their ability to concentrate, one of the highest rates in the OECD.
Estonia, by contrast, has quietly become Europe's top-performing education system. It achieves this with per-pupil spending well below the OECD average. Every teacher holds a master's degree. Education is free from preschool through university, with meals, textbooks, and transport provided at no cost. There is no tracking into ability groups until age 16. The result, according to the OECD, is one of the smallest performance gaps between advantaged and disadvantaged students in the world. The irony is hard to miss: Estonia succeeded by holding onto the equity model Finland is losing.
Jordan Lost 57 Points. Albania Lost 53. The Pandemic Is Only Part of the Story.
The countries that collapsed in 2022 did not just have bad years. They faced compounding crises that COVID made worse but did not create.
Jordan posted the largest absolute decline in the entire dataset: 57 points, falling from 416 to 359. That translates to nearly two full years of learning lost in a single cycle. According to the OECD's Jordan country note, 65% of Jordanian students reported school closures lasting more than three months. The country's digital infrastructure was not equipped for remote learning. Parental disengagement and low student motivation compounded the problem.
Albania's story is worse and more complicated. It fell 52.7 points, from 419.7 to 367, dropping 18 spots in the rankings. But the pandemic was the second shock, not the first. In November 2019, a devastating earthquake damaged schools across 12 major cities. Roughly half of the students who sat for PISA 2022 had spent portions of their schooling in temporary facilities with reduced hours. When COVID arrived months later, the disruption layered on top of infrastructure that was already broken.
Not every country lost ground. Taiwan climbed from 516.7 to 533, a 16.3-point gain that moved it into a tie for third. Japan rose from 520 to 533. The Dominican Republic, starting from the second-lowest score in the 2018 dataset, added 15.7 points. Switzerland climbed 10 spots in the rankings. Australia moved up 8. The pattern is not random. The countries that gained tended to have educational systems that adapted to disruption rather than breaking under it.
The Subjects Tell Different Stories
PISA does not test one skill. It tests three. And the results diverge in ways the composite score hides.
Every country in the top six for math is in East Asia. Singapore leads at 575, followed by Macau, Taiwan, Hong Kong, Japan, and South Korea. No European or Anglophone country cracks that top tier.
In reading, that dominance cracks. Ireland (516) ties with Japan for second place. Estonia (511) outperforms both Hong Kong and Macau. The United States scores 504 in reading, good enough to sit in the top 10, a position that puts it alongside New Zealand and Australia.
The US illustrates the subject split more sharply than almost any other major economy. It scores 504 in reading but just 465 in math, a 39-point gap that represents more than a year of learning. Few developed countries show that kind of internal divide. Japan runs in the opposite direction: 536 in math, 516 in reading, a 20-point advantage in the quantitative domain.
Macau reveals another version of the split. It ranks second overall at 535, pulled up by the second-highest math score in the world (552). But in reading, Macau drops to 510, behind Ireland, South Korea, Taiwan, and Estonia. The Netherlands shows a similar pattern: 493 in math but only 459 in reading. For countries where the composite score creates a misleading impression of balanced strength, the subject breakdown tells a more honest story.