The Lifeblood of Modern Economies: Oil Production by Country
Crude oil, often called black gold, is the lifeblood of modern economies. This fossil fuel not only powers our cars and heats our homes, but it also plays a critical role in sectors like manufacturing, production, and technology. This article offers an in-depth exploration of oil production on a global scale, focusing on the most recent data available. In 2022, according to data gathered from across the world, varying rates of oil production were observed across countries, thereby inherently influencing their economies — both directly and indirectly. A few key findings from the data include:
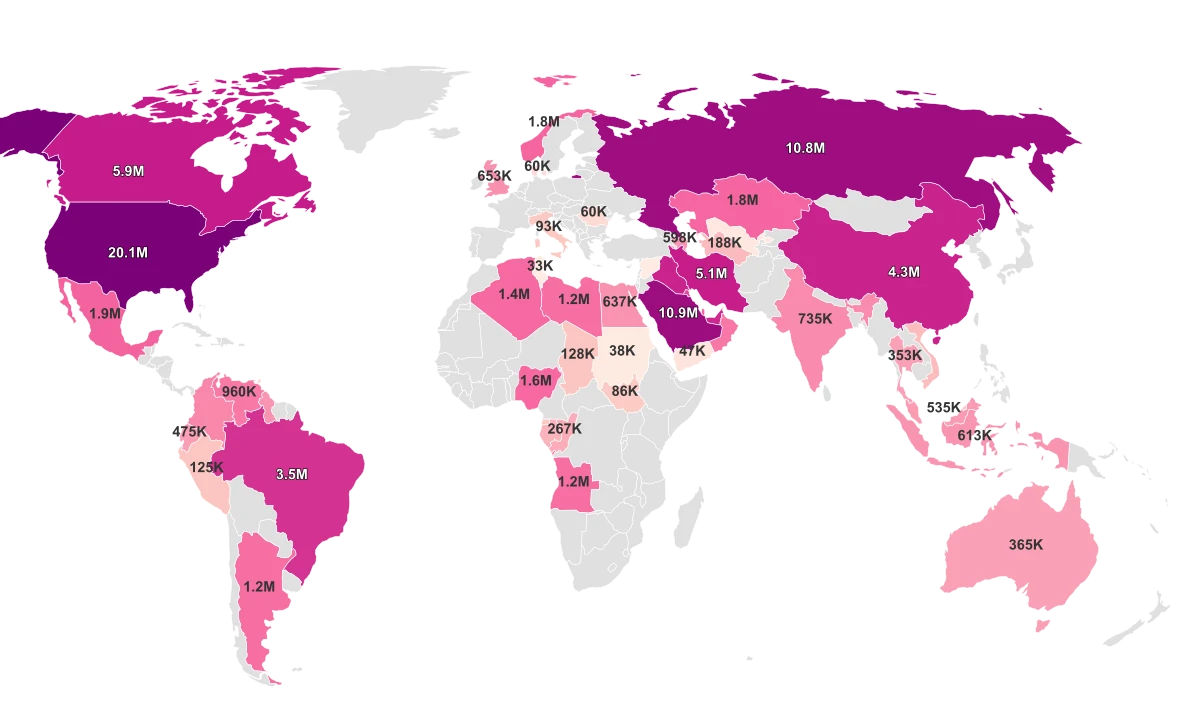
- The United States leads the world in daily oil production with 11.6 million barrels produced per day. This high output underscores the critical role of the oil industry in powering the American economy.
- Russia and Saudi Arabia followed close behind with substantial daily oil production of 10.5 and 10.2 million barrels respectively, reinforcing their status as indispensable players within the global oil market.
- Nations like Iraq, China, and Canada also emerge as significant contributors in the international oil industry, with outputs upwards of 4 million barrels a day.
- Despite the substantial production by these top-tier countries, oil production is a global phenomenon, reaching even into less economically prominent nations such as Barbados and Belize which still produce 1.0 thousand barrels daily.
- The concentration of oil production across various countries exhibits a noteworthy geographical distribution, with key players dispersed across North America, the Middle East, and parts of Africa and Asia. Understanding the global landscape of oil production is vital, as it provides a foundation for predicting future trends in energy demand, economic growth, and environmental impacts, ultimately guiding policy-making and business decisions around the world. The rich data available on oil production by country serves as a lodestar, illuminating the complex world of energy politics, economics, and sustainability.
Top Oil Producing Countries
The top ten oil producing countries in terms of daily barrels produced are United States, Russia, Saudi Arabia, Canada, Iraq, China, United Arab Emirates, Brazil, Kuwait, and Iran. The leading country in the oil production sector is the United States, boasting an impressive production of 11.6 million barrels per day. Next, Russia follows closely behind with daily oil production at 10.5 million barrels. Saudi Arabia ranks third, contributing 10.2 million barrels to the world's daily oil production. Canada and Iraq are next on the list producing 4.7 and 4.3 million barrels per day, respectively. Meanwhile, China contributes a significant figure of 4.0 million barrels per day to the global tally. The United Arab Emirates and Brazil are next in line, with outputs of 3.0 and 2.9 million barrels per day, respectively. Lastly, contributing to the top ten are Kuwait and Iran, each producing 2.6 and 2.5 million barrels of oil per day respectively. 10 Oil Producing Countries with their Daily Oil Production in Millions of Barrels:
- United States - 11.6M
- Russia - 10.5M
- Saudi Arabia - 10.2M
- Canada - 4.7M
- Iraq - 4.3M
- China - 4.0M
- United Arab Emirates - 3.0M
- Brazil - 2.9M
- Kuwait - 2.6M
- Iran - 2.5M