Four Cities Report Zero Murders. Two Report More Than 50 per 100,000.
The FBI defines murder as the willful, non-negligent killing of one human being by another. The rates in this ranking come from the Bureau's Crime Data Explorer, calculated per 100,000 residents within each city's police jurisdiction. That jurisdiction part matters enormously, and it is the single most important thing to understand before reading any further.
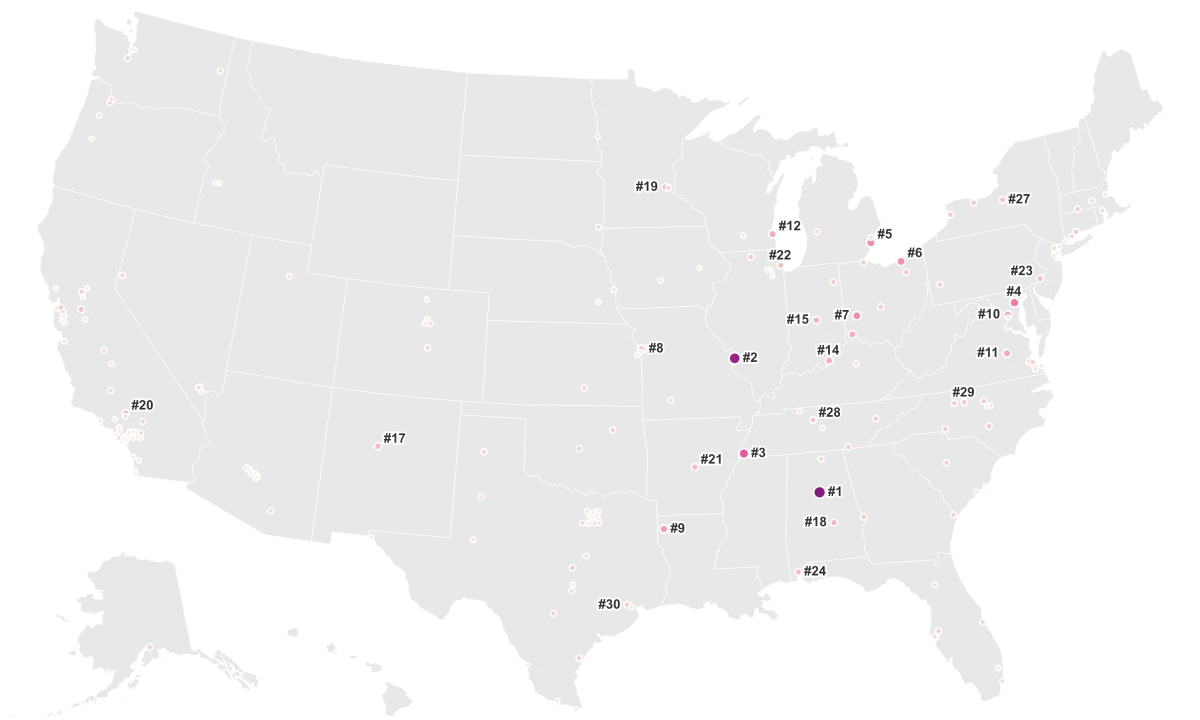
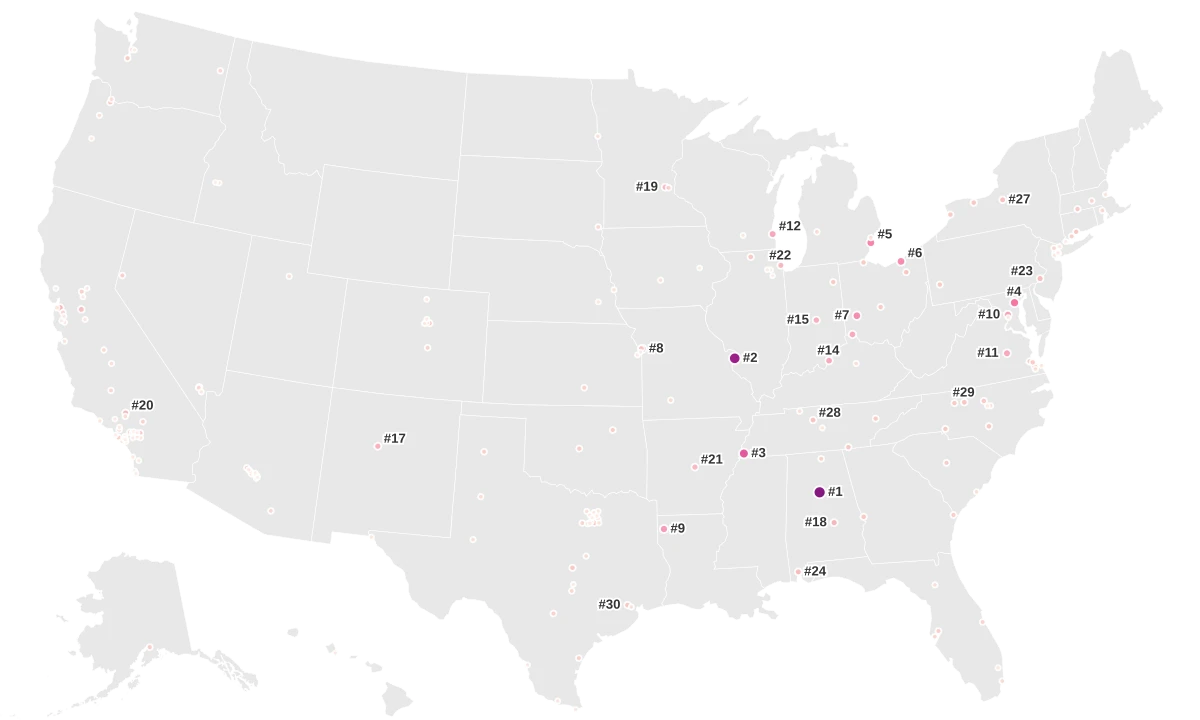
Birmingham, AL leads the dataset at 58.85 murders per 100,000 people. St. Louis, MO follows at 54.09. At the opposite end, Joliet, IL, Torrance, CA, Overland Park, KS, and Orange, CA all report rates of 0.00. The full spread across 199 cities covers nearly 59 points on a per-capita scale, a gap that makes the ranking look like it describes two different countries.
Most cities sit nowhere near the extremes. The average murder rate across the dataset is 8.22 per 100,000, but the median is just 5.86. That gap signals a distribution pulled upward by a handful of outliers: nine cities with murder rates above 25 per 100,000 inflate the average while the majority cluster in the single digits. More than half of all cities in this dataset report murder rates below 6 per 100,000.
The City That Split From Its County in 1876 Never Stopped Paying for It
St. Louis is one of the most misunderstood entries on any American crime ranking. In 1876, the city voted to separate from St. Louis County, becoming an independent city, a legal distinction it shares with only a handful of places in the country. That decision, made 150 years ago, still distorts every crime statistic published about the city today.
The result is that St. Louis City has a population of roughly 300,000 and sits on 66 square miles. St. Louis County, which surrounds it, holds nearly one million additional people. When the FBI calculates murder rates, it uses the city's jurisdiction as the denominator. That excludes the entire suburban ring. Most American cities include at least some suburban or lower-density areas within their limits, which dilutes per-capita crime rates. St. Louis does not get that cushion.
Criminologists have noted that if St. Louis City and County were a single entity, as is common for similarly sized metropolitan areas, the combined murder rate would fall dramatically. The city has real challenges with violent crime. But its placement at the top of this ranking reflects a boundary anomaly as much as it reflects a safety crisis.
Birmingham does not have the same boundary excuse. It has a population of roughly 200,000 and recorded 149 homicides in 2024, breaking a record that had stood since 1933. The city's poverty rate sits near 25%, roughly double the national average. Violence is concentrated in a small number of neighborhoods where unemployment, limited access to education, and cycles of retaliatory conflict compound each other. Alabama's passage of constitutional carry, which eliminated the permit requirement for concealed firearms, has added another structural layer.
New York Has Eight Million People and a Murder Rate Lower Than Fargo's
New York City reports a murder rate of 3.92 per 100,000 residents. Fargo, ND reports 4.42. On a per-capita basis, America's largest city is safer from murder than a mid-sized city in North Dakota.
Part of that is arithmetic. New York's population of 8.3 million creates an enormous denominator. Even several hundred homicides per year produce a low per-capita rate when spread across that many people. But the decline is also real. In the early 1990s, New York recorded more than 2,200 murders a year. By the mid-2020s, that number had fallen below 400. The causes are debated: data-driven policing strategies, demographic shifts, reduced lead exposure, the winding down of the crack epidemic, and sustained economic growth all likely played a role.
Chicago offers the counterpoint. Its murder rate of 17.47 is high for a city of 2.7 million people, and the city's reputation as a violence epicenter is entrenched. But 17.47 places Chicago below 40 smaller cities in this dataset, including Nashville (14.59), Greensboro (14.13), and Houston (13.80). Population scale compresses per-capita rates, which means Chicago's raw homicide count can dominate headlines even as dozens of smaller cities face worse per-capita outcomes with far less national attention.
Los Angeles (6.95) and San Diego (2.52) tell a similar story. Both are sprawling cities with populations above one million. Their geographic footprints include suburban neighborhoods, university districts, and beach communities alongside denser urban cores. The result is a blended rate that can obscure neighborhood-level variation. A per-capita number for a city of 4 million people is a composite of realities that may have very little to do with each other.
Some Cities Are Far More Violent Than Their Murder Numbers Suggest
Murder rates capture the most extreme outcome of violent crime. They do not capture how much violence a city actually experiences day to day. Aggravated assault rates tell that second story, and sometimes the two stories diverge sharply.
Springfield, MO reports a murder rate of just 5.86 per 100,000, almost exactly at the national median. But its aggravated assault rate is 944.13 per 100,000, the 11th highest in the dataset. A resident of Springfield is far more likely to be a victim of violent crime than a resident of many cities that rank higher in murders. The rate just does not end in death as often.
Murder and Assault Track Together, but Not Perfectly
Murder Rate vs. Aggravated Assault Rate across 197 cities. Most cities follow a tight line, but outliers like Springfield, MO show far more violence than their murder numbers suggest.
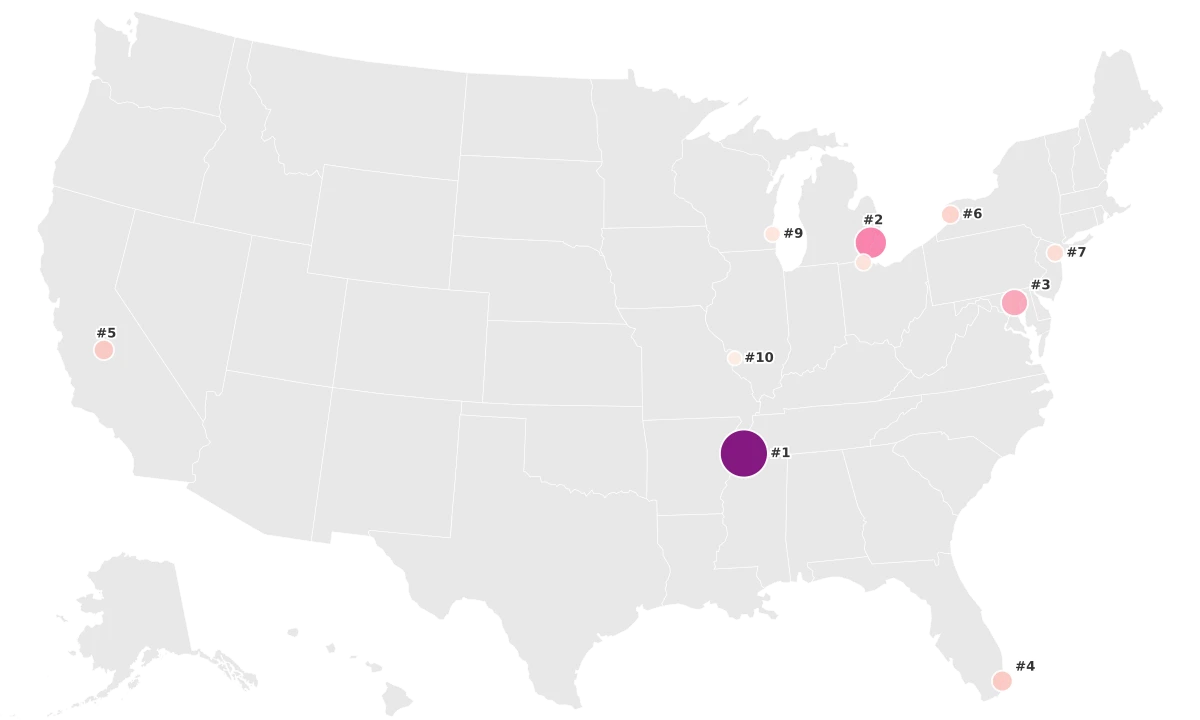
Memphis leads both rankings: 40.61 murders and 2,042.05 aggravated assaults per 100,000 people, more than double the next-closest city for assaults. Detroit (31.17 murders, 1,473.65 assaults) and Little Rock (17.63 murders, 1,321.44 assaults) show the same dual-metric dominance. In these cities, violence is pervasive, and it frequently turns lethal.
The "Murder as % of Violent Crimes" metric reveals which cities' violence kills at a disproportionately high rate. Richmond, VA leads at 7.2%: more than one in fourteen violent crimes in Richmond ends in death, the highest lethality share in the dataset. Researchers have pointed to trauma care quality as one factor that separates cities where assaults become murders from cities where they do not. Cities with Level I trauma centers and faster EMS response times tend to convert more gunshot wounds into survived assaults. Where trauma infrastructure is weaker or response times are longer, the same injuries are more likely to be fatal.
The Same Cities Keep Appearing at the Top of Every Crime Metric
Two geographic clusters dominate the upper reaches of this ranking, and neither is in the region most Americans associate with big-city crime.
Ohio places six cities in the top half of the murder ranking. Cleveland (30.05) and Dayton (29.66) are both statistical outliers, with murder rates more than three times the dataset median. Cincinnati (21.82) is not far behind. All three sit among the most dangerous cities in a dataset of nearly 200.
Akron (12.75), Columbus (12.23), and Toledo (12.14) round out the Ohio cluster at rates roughly double the median. All six cities share a post-industrial profile: populations that peaked in the mid-20th century and have since shrunk, tax bases that eroded as manufacturing left, and an opioid crisis that hit the state harder than almost anywhere else.
The Deep South cluster is even more concentrated. Birmingham (58.85), Memphis (40.61), and Shreveport (26.84) anchor a corridor of elevated violence running from central Alabama to northern Louisiana.
Montgomery (18.07) and Mobile (16.45) extend that corridor further south. These five cities share concentrated poverty, limited public investment in social infrastructure, and high rates of firearm ownership in states with permissive gun laws.
What both clusters have in common is deindustrialization or the absence of a diversified economy. The safest cities in the dataset, places like Irvine, CA (1.58), Naperville, IL (0.66), and Gilbert, AZ (0.36), are affluent suburbs or planned communities with strong tax bases, well-funded services, and populations that largely avoided the economic shocks that hollowed out the cities at the top of this ranking. The gap between them is not just a crime statistic. It is a map of where economic decline concentrates and where it does not.