Nearly 4.5 Million People in a Handful of States
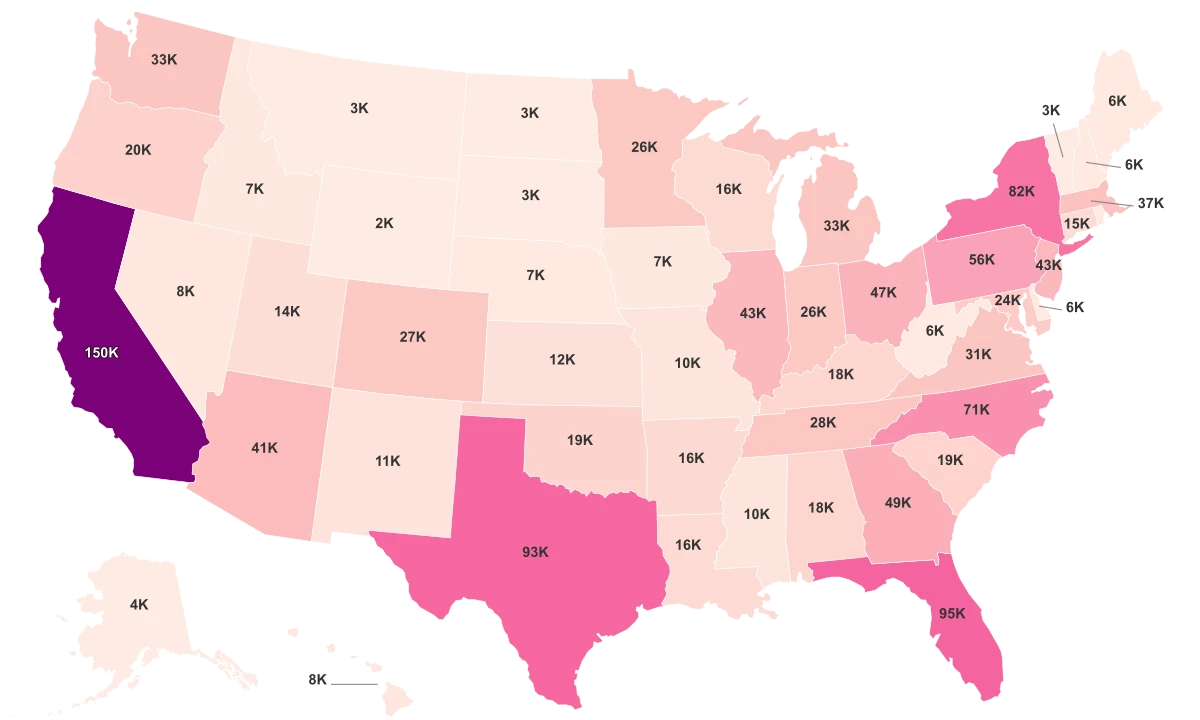
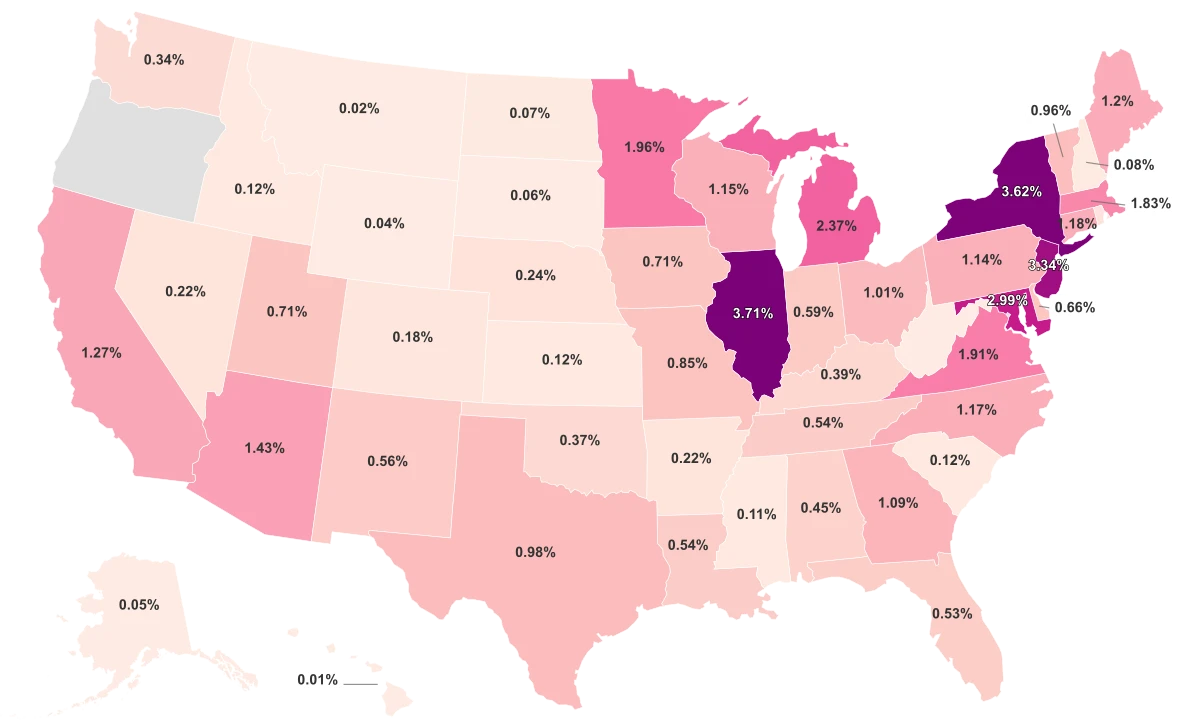
The United States is home to roughly 4.45 million Muslims, according to the 2020 U.S. Religion Census conducted by the Association of Statisticians of American Religious Bodies. That total is spread across all 50 states, but the distribution is anything but even. Illinois leads the country at 3.71% of its population. Hawaii sits at the bottom at 0.01%, with just 145 mosque-affiliated Muslims counted in the entire state.
The top of the ranking clusters in two corridors. The Northeast averages 1.51%, driven by New York (3.62%), New Jersey (3.34%), and Maryland (2.99%). The Midwest averages 1.07%, anchored by Illinois and Michigan (2.37%). The South sits at 0.76%, and the West is lowest at just 0.41%.
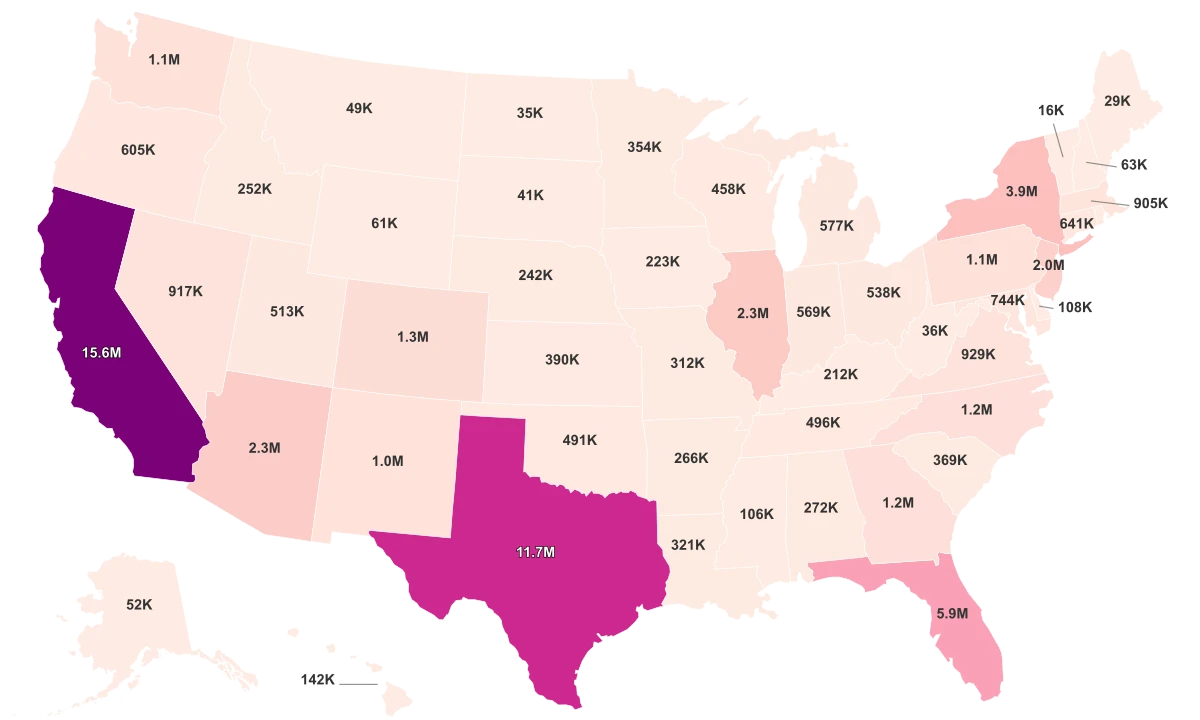
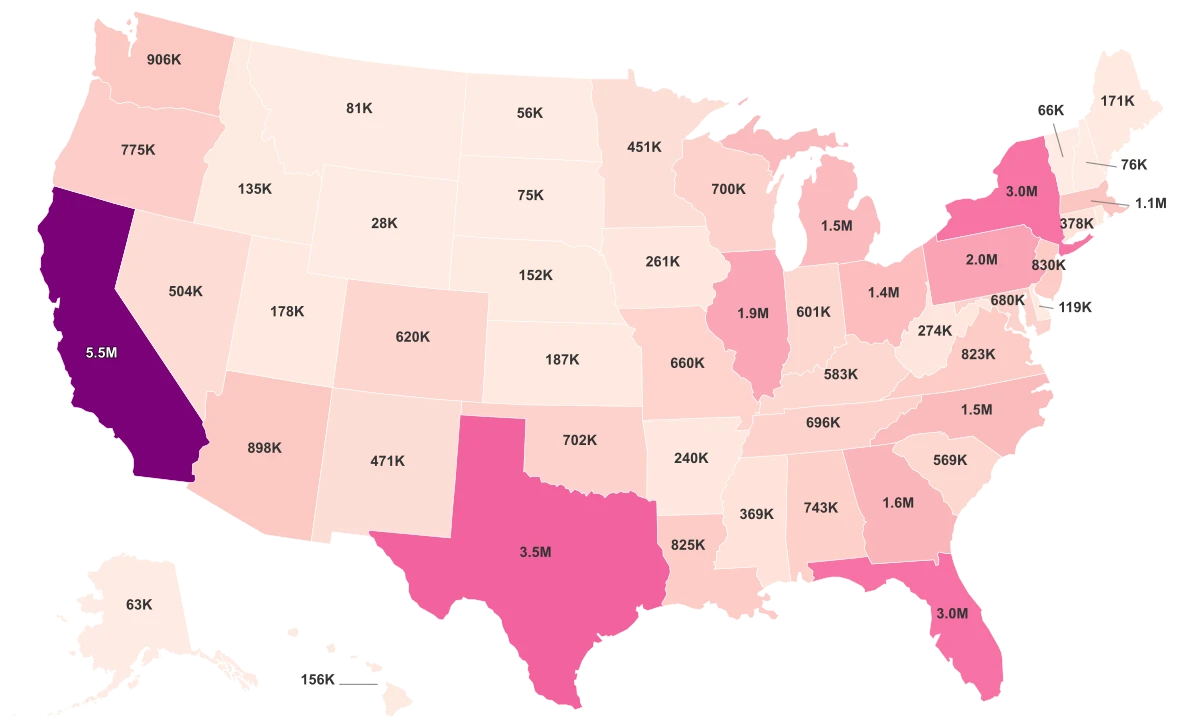
The concentration is extreme. Over 52% of all Muslim Americans counted in this census live in just five states: New York, California, Illinois, New Jersey, and Texas. New York alone accounts for more than 724,000 people. The remaining 44 states share the other half.
That concentration also creates a gap between the percentage and absolute rankings that is easy to misread. California has the second-largest Muslim population in the country by raw count, more than 504,000 people. But it ranks just 10th by percentage because its 39 million residents dilute the share to 1.27%. Texas is 5th by count but 18th by percentage at 0.98%. Where most Muslims live and where Muslims make up the largest share of the population are two different questions.
A Century of Settlement Built the Top of This Ranking
The states at the top of this ranking did not arrive there by accident. They are the product of more than a century of layered immigration, each wave reinforcing the communities built by the one before it.
The first significant wave came in the late 19th and early 20th centuries, when immigrants from the Levant, primarily Lebanon and Syria, arrived in search of industrial work. Many settled in the factory towns of the Midwest and the port cities of the Northeast. Michigan's Muslim community traces directly to this era. Henry Ford's River Rouge Complex in Dearborn offered well-paying factory jobs, and by the 1920s a Lebanese Muslim neighborhood had taken root in the city's Southend.
Today, Dearborn has roughly 54.5% Middle Eastern or North African ancestry according to 2023 Census Bureau data, and is home to the Islamic Center of America, the largest mosque in North America. It is the clearest example of how an early industrial foothold became a self-reinforcing community anchor over the course of a century.
The second major wave followed the Immigration and Nationality Act of 1965, which abolished national-origin quotas and opened the door to immigration from Muslim-majority countries across Asia, Africa, and the Middle East. Professionals, students, and laborers arrived in larger numbers, settling in cities where earlier immigrants had already built mosques, halal grocery stores, and Islamic schools. Chicago, New York, and the northern New Jersey corridor became magnets for these new arrivals.
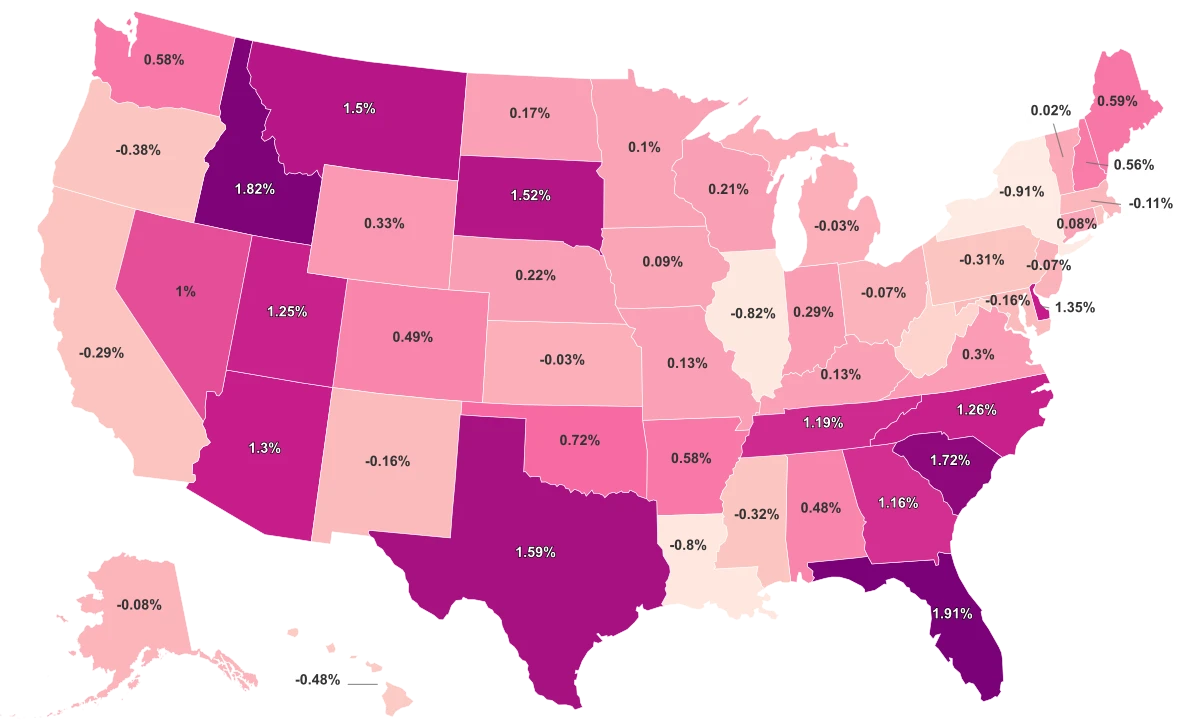
Virginia (1.91%) and Maryland tell a more specific version of this story. Both sit in the Washington, D.C. metropolitan corridor, where professional opportunities in government, defense contracting, and international organizations have drawn immigrants from across the Muslim world. Together, the two states account for more than 358,000 Muslim residents.
Refugees Reshaped the Middle of the Map
The top of the ranking reflects a century of voluntary immigration. Several states in the middle reflect something different: federal refugee resettlement.
Minnesota ranks 6th at 1.96%, with nearly 115,000 Muslim residents. That figure is driven overwhelmingly by Somali refugees. Beginning in the early 1990s, the U.S. State Department resettled thousands of Somalis displaced by civil war, and Minneapolis became the primary receiving city. Community networks, social services, and affordable housing drew subsequent waves through family reunification. The result is the largest concentration of Somali Americans in the country, centered in neighborhoods like Cedar-Riverside.
Maine tells a parallel story on a smaller scale. The state ranks 11th at 1.20%, with roughly 16,900 Muslims in a state of 1.4 million people. Much of this community arrived in the early 2000s, when Somali Bantu refugees began resettling in Lewiston. The population grew through secondary migration, as refugees already in the U.S. relocated from larger cities in search of lower living costs and safer neighborhoods.
Arizona (1.43%, ranked 9th) reflects a different flavor of the same mechanism. The Phoenix metropolitan area has received significant numbers of Iraqi, Afghan, and Somali refugees through federal resettlement programs over the past two decades. That refugee infrastructure layered on top of earlier professional immigration from South Asia and the Middle East in the 1980s and 1990s, producing a community of roughly 110,000. None of these three states had significant Muslim populations before the 1990s.
What a Mosque Count Misses
The numbers in this ranking come from the U.S. Religion Census, a study conducted roughly every 10 years by the Association of Statisticians of American Religious Bodies. The federal Census does not ask about religion, which means there is no government count of Muslim Americans. The Religion Census fills that gap, but its methodology has significant blind spots.
ASARB counts "adherents" by collecting data from individual mosques and Islamic centers, a category that includes members, their children, and regular attendees. The study identified 2,771 mosques and roughly 4.45 million adherents nationwide. The limitation is that this method captures only Muslims affiliated with a congregation. Anyone who identifies as Muslim but does not regularly attend a mosque, or practices privately, is not counted.
The gap shows up in comparison with other estimates. Pew Research Center's 2017 survey of U.S. Muslims estimated 3.45 million Muslim Americans using telephone surveys and demographic modeling. That is roughly one million fewer than ASARB's 2020 congregation-based count, despite being conducted three years earlier. The discrepancy is methodological, not a sign of explosive growth. Pew captures self-identifying individuals regardless of mosque attendance. ASARB captures institutional affiliation. Neither method fully measures the population.
For states at the bottom of the ranking, the undercounting likely matters most. Montana (0.02%, 200 people), Wyoming (0.04%, 226), and Hawaii (0.01%, 145) each have so few mosque-affiliated Muslims that even a single uncounted community could meaningfully shift their ranking. The percentages at the bottom reflect the limits of the data as much as the actual demographics.