What This Ranking Actually Measures
This ranking is built on federal public corruption convictions, not on corruption itself. The distinction matters more here than in almost any other dataset. The numbers come from the Department of Justice's Public Integrity Section, which tracks every person convicted of a federal public corruption crime across all 94 federal judicial districts. The data was compiled and analyzed by the University of Illinois at Chicago in its Anti-Corruption Report.
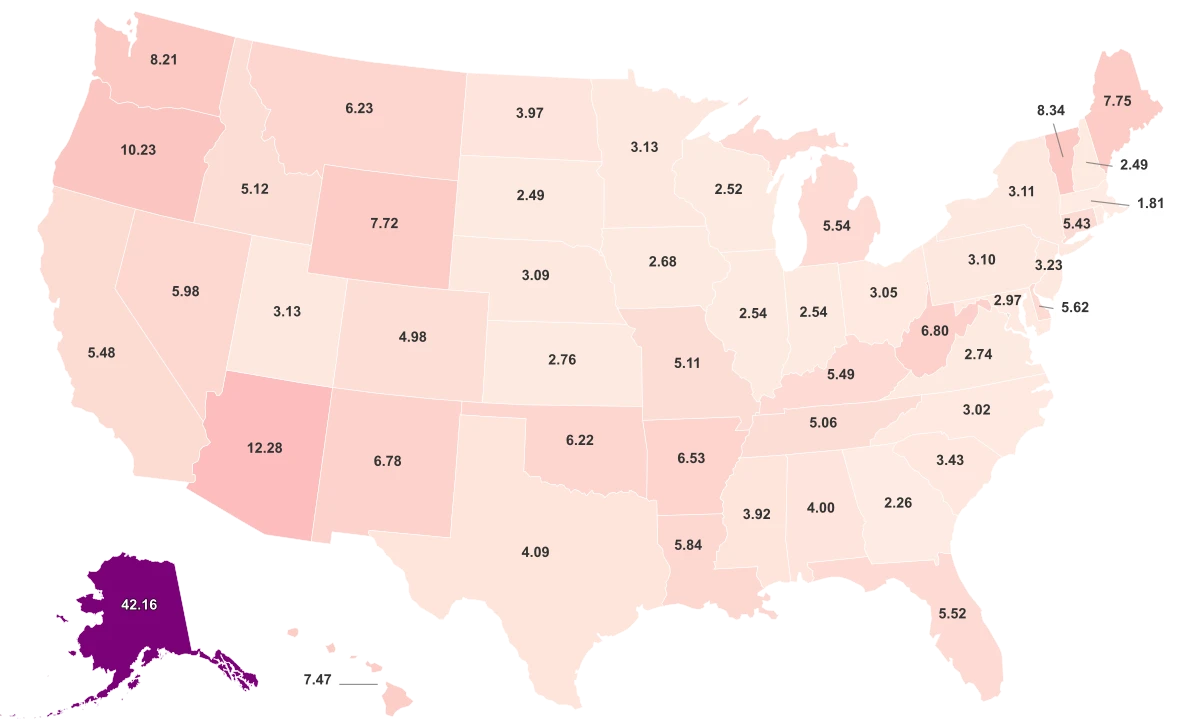
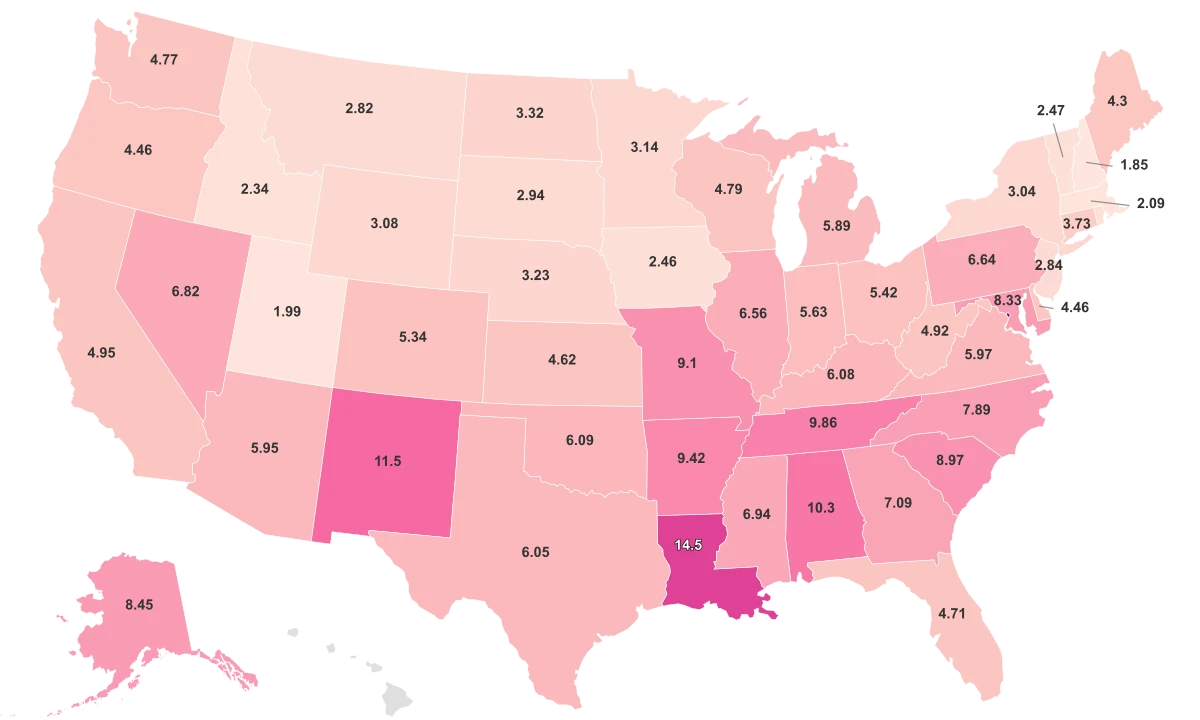
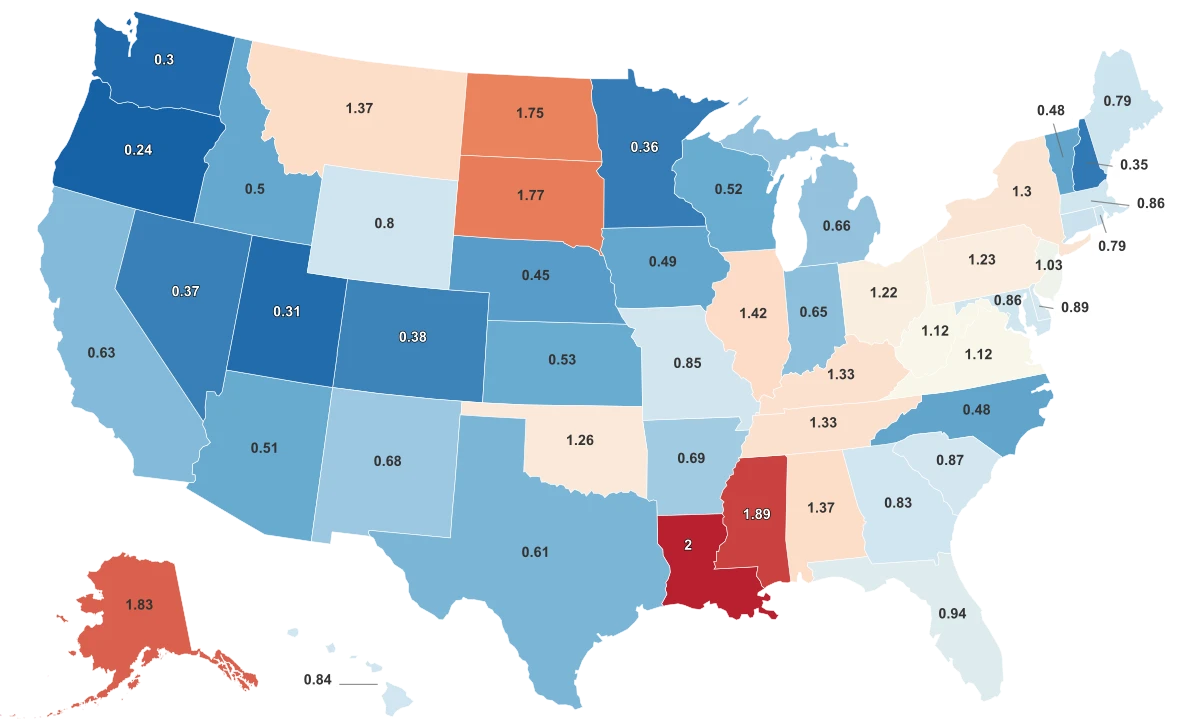
Louisiana leads the ranking at 2.00 convictions per 10,000 residents. Mississippi (1.89) and Alaska (1.83) follow. At the other end, Oregon sits at 0.24, with Washington (0.30) and Utah (0.31) just above it. The full range is 1.76 convictions per 10,000, roughly an eightfold difference between the most and least convicted states.
The South stands apart. Southern states average 1.10 convictions per 10,000 residents, 63% higher than the West at 0.67. The Midwest (0.89) and Northeast (0.85) sit in between. But before reading these numbers as a corruption map, it helps to understand what they can and cannot tell you.
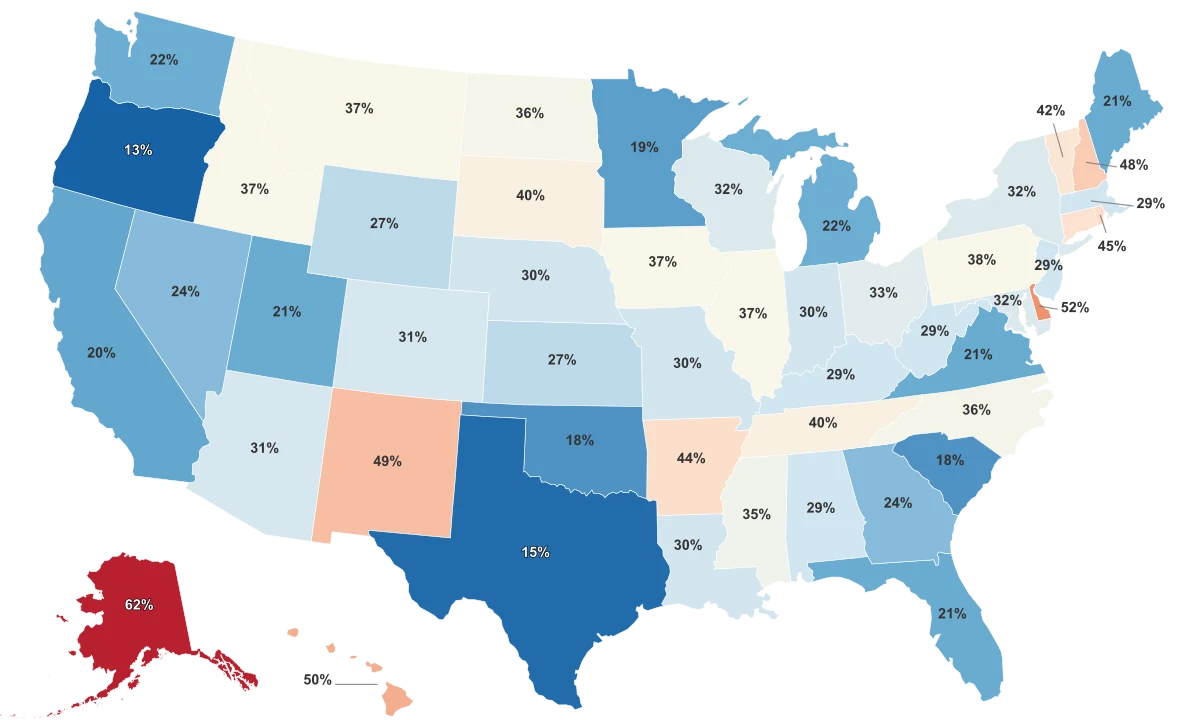
New York Has the Most Convictions. Louisiana Has the Highest Rate.
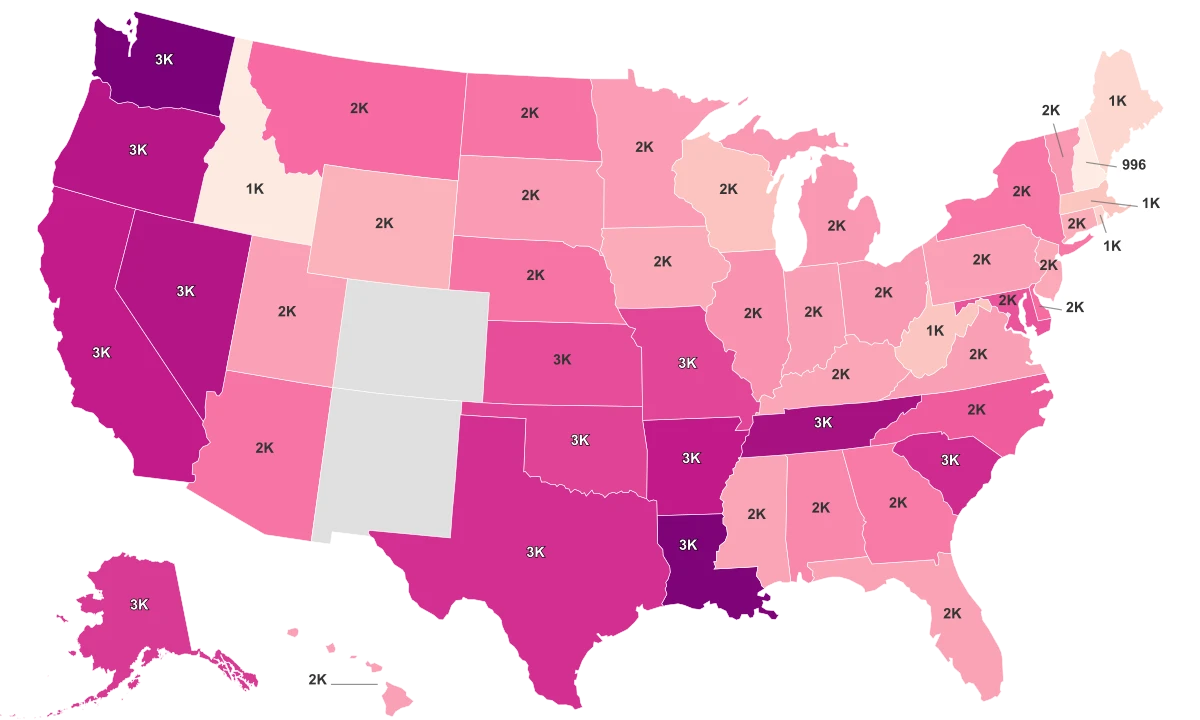
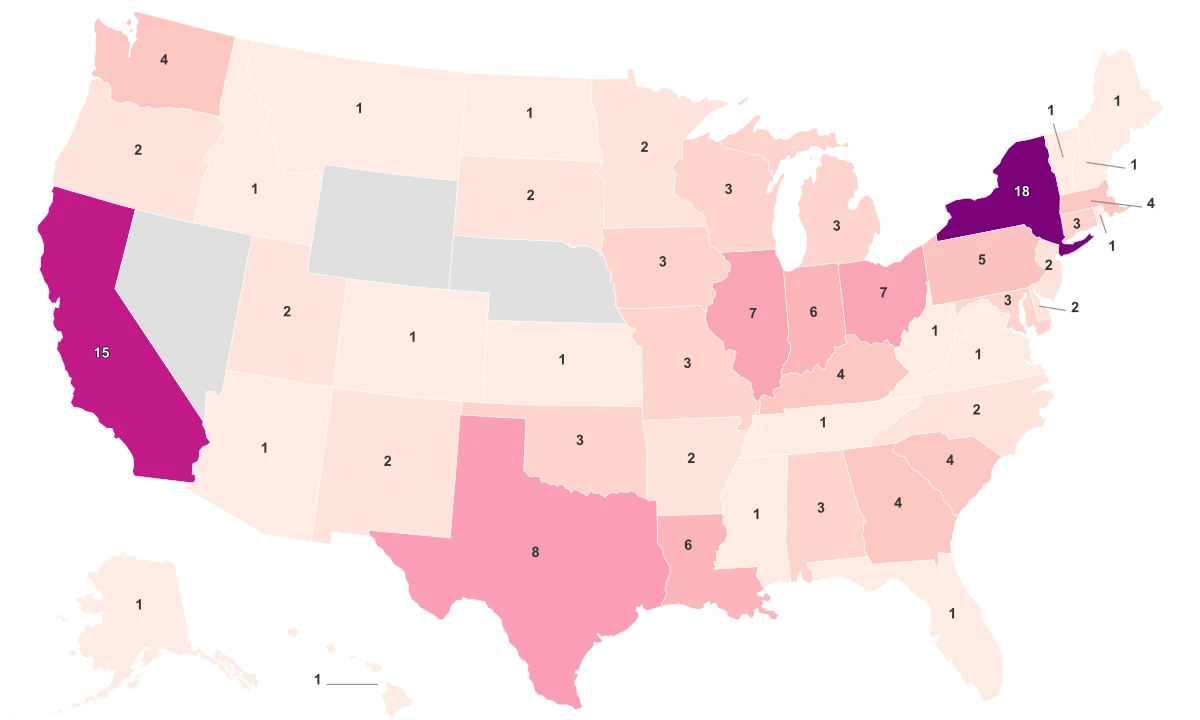
The most counterintuitive finding in this dataset is that the states with the most total corruption convictions are not the states with the highest rates. New York leads the country with 2,522 total convictions, more than any other state. California is second with 2,345. Illinois is third with 1,828. Together with Florida and Pennsylvania, those five states account for 37% of all federal corruption convictions in the country.
But adjust for population and the picture inverts. New York's rate is 1.30, which places it outside the top five. California's rate is just 0.63, dropping it into the bottom third of the ranking. Louisiana, with 906 total convictions, has fewer than half of New York's total but a rate nearly 54% higher.
The States With the Most Convictions Are Not the 'Most Corrupt'
Federal corruption conviction rate vs. total convictions across all 50 states. Large states dominate total counts but fall to the middle or bottom when adjusted for population.
The scatter makes the disconnect visible. The largest states cluster in the lower-right corner: high absolute counts but modest or low per-capita rates. The most "corrupt" states by rate cluster in the upper-left: small populations where even a few hundred convictions produce outsized rates. This is the central tension of the entire ranking. Whether Louisiana is "more corrupt" than New York depends entirely on which number you choose to read.
The South Leads, and the Reasons Predate the Data
The South's lead is not a statistical fluke. Six of the top ten states by conviction rate are Southern, and the region's average of 1.10 per 10,000 is higher than any other. The structural explanations run deeper than any single scandal.
Louisiana is the textbook case. The state's political culture was shaped by Huey P. Long, who built a patronage machine in the 1930s that delivered roads, schools, and bridges in exchange for absolute political loyalty. Long was assassinated in 1935, but the machine he built outlived him by decades. The state's reliance on oil and gas revenue, which funnels enormous sums through government contracts and regulatory agencies, created a persistent structural opportunity for graft.
The convictions kept coming across generations. Governor Edwin Edwards was convicted of federal racketeering charges related to riverboat casino licenses. Congressman William Jefferson was found with $90,000 in cash in his freezer. Mayor Ray Nagin went to prison for bribery. No other state in the dataset has produced federal corruption cases at every level of government with this consistency.
Illinois (1.42 per 10,000) tells a parallel story through a different machine. Four Illinois governors have been convicted of federal crimes in the modern era: Otto Kerner Jr., Dan Walker, George Ryan, and Rod Blagojevich, who was convicted in 2011. Chicago's ward-based patronage system, built under Anton Cermak and sustained for most of the 20th century, institutionalized the exchange of government jobs and contracts for political support. Researchers at the University of Illinois at Chicago have described it as a system where "using public office for personal benefit became normalized."
Mississippi (1.89) and Alabama (1.37) round out the Southern concentration at the top. Both states share a history of weak ethics oversight, limited campaign finance transparency, and political systems where single-party dominance reduced the electoral pressure to police corruption.
Convictions Measure Enforcement, Not Corruption
The most important thing this ranking cannot tell you is how corrupt a state actually is. Convictions are an output of the justice system, not a census of corrupt behavior. A state with aggressive federal prosecutors will produce more convictions than an equally corrupt state where the U.S. Attorney's office is focused on drug cases or immigration enforcement.
This limitation is sharpest for the small states at the top. Alaska ranks third at 1.83, but its total population is under 750,000. A single multi-defendant federal case can move Alaska's per-capita rate more than a comparable case would move California's. South Dakota (1.77) sits fourth for a similar reason, and researchers at the Cato Institute have noted that federal prosecutions of financial misconduct on tribal lands, where federal law enforcement has direct jurisdiction, contribute meaningfully to South Dakota's count.
The states at the bottom of the ranking deserve equal skepticism. Oregon (0.24) and Washington (0.30) appear nearly corruption-free, but low conviction numbers may partly reflect federal districts that prioritize other types of cases. Political scientists studying state corruption have pointed to Daniel Elazar's theory of political subcultures: Western states with "moralistic" political traditions, where public service is viewed as a civic duty, may genuinely have less graft. But they also tend to have stronger transparency laws and competitive bidding requirements, which prevent certain types of corruption from occurring in the first place rather than catching it after the fact.
What the data does show reliably is where the federal government has concentrated its corruption enforcement over many years. The patterns in the South and in machine-politics states like Illinois are too persistent to dismiss as prosecutorial coincidence. But the difference between the "most convicted" and the "most corrupt" is a gap this data was never designed to close.