Introduction
The complex panorama of safety across the United States is increasingly inviting comprehensive study, as concerns arise over disparate quality of life indices in different states. As integral as safety is to any society's fabric, it serves as a crucial deciding factor for families seeking to relocate and shape their futures. In the light of the Global Peace Index ranking the U.S. as the 128th-safest country in the world out of 163, a deeper dive into safety metrics at the state level offers valuable insights.
Drawing from a diverse range of 53 indicators, we devised a 'Danger Index Score' to measure the safety, or lack thereof, in all 50 states. These cover Personal & Residential Safety, Financial Safety, Road Safety, Workplace Safety, and Emergency Preparedness, offering a comprehensive view of each state's safety status.
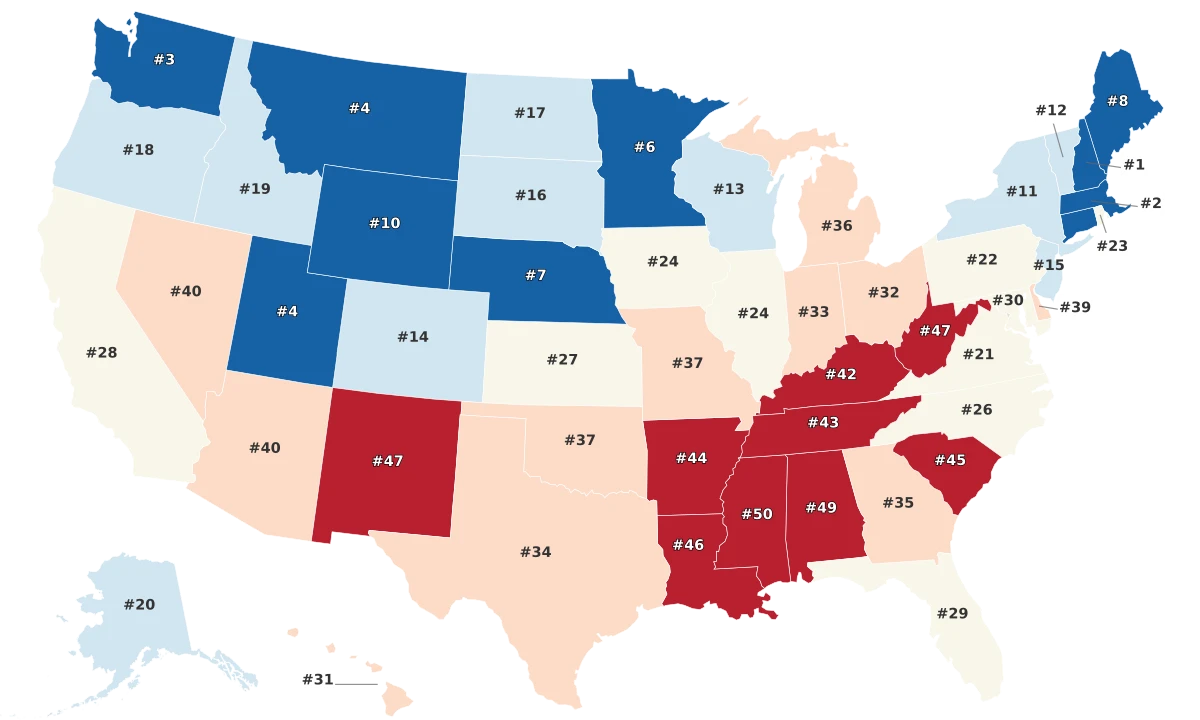
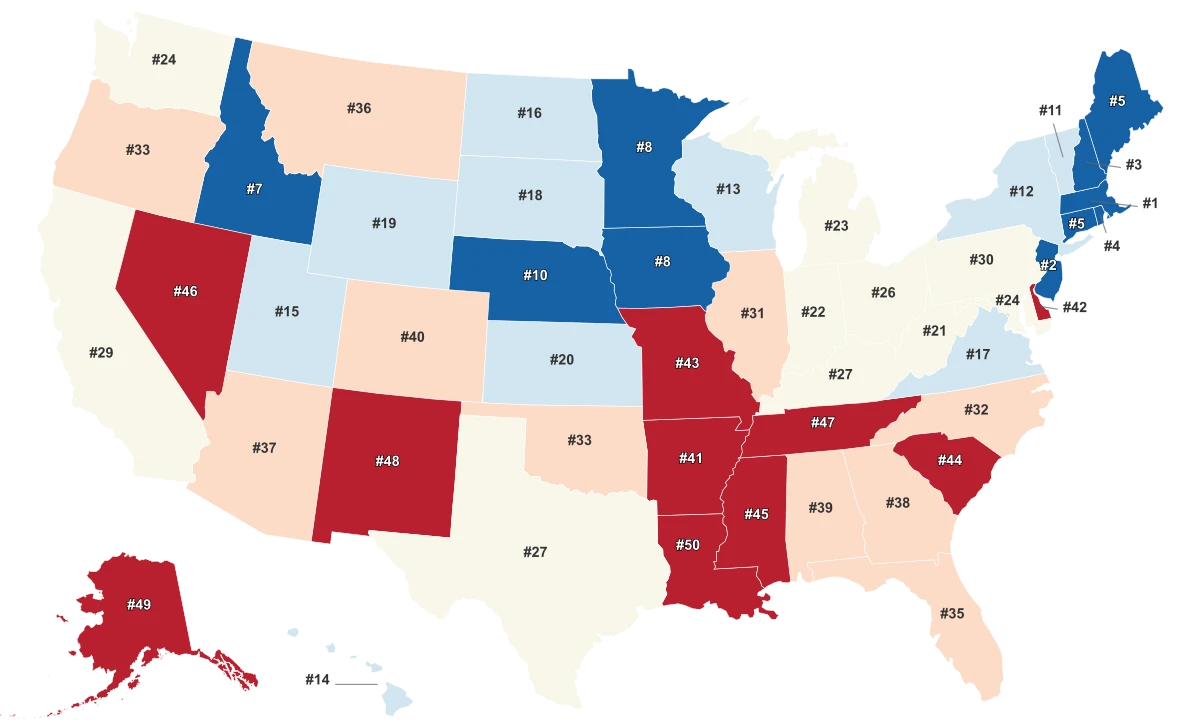
- Massachusetts, with a score of 80.4, makes it the safest state in the United States, followed by New Jersey at 79.4. The third and fourth positions go to New Hampshire and Rhode Island, both of which are in New England, indicating a clustering of safety in this region.
- Louisiana, with the lowest score at 51.4, is considered the most dangerous state. Alaska and New Mexico follow closely behind, with scores of 55.1 and 55.4 respectively.
- There is a noteworthy split between states from the southern part of the United States and those from the northeast region: Southern states tend to have lower 'Danger Index Scores', thus implying a higher level of danger, while northeastern states - exemplified by Massachusetts, New Jersey, Rhode Island, and Vermont - are perceived as safer, with higher scores.
Methodology
To determine the safest states the 50 states were compared across five key categories:
- Crime and Law Enforcement
- Firearms and Violence
- Welfare and Personal Security
- Safety & Social Equity
- Transportation Safety Each of these was defined via individual metrics that were representative of the category. There were a total of 32 metrics which are listed below. Each metric was graded on a 100-point scale, with a score of 100 being the max. Each metric had state scores distributed from 0 to 100. Finally, each state’s weighted average was determined across all metrics to calculate category scores. These were then summed to generate the final rank order of the states.
Crime and Law Enforcement (30%)
- **Violent Crime Rate - **Triple Weight (7.2)
- **Non-violent Crime Rate - **Regular Weight (2.4)
- **Recidivism Rate - **Regular Weight (2.4)
- **Human Trafficking Cases Rate per 100K - **Double Weight (4.8)
- **Homicides per 100k People - **Double Weight (4.8)
- **Imprisonment Rate per 100k residents - **Half Weight (1.2)
- **Police Officers per 100k - **Double Weight (4.8)
- **Assault Rate per 100k - **Regular Weight (2.4)
Firearms and Violence (25%)
- **Gun Ownership Rate - **Regular Weight (3.6)
- **Mass Shootings Rate per 100k - **Double Weight (7.1)
- **Gun Deaths per Capita - **Triple Weight (10.7)
- **Nonfatal Gun Injuries per 100k - **Regular Weight (3.6)
Welfare and Personal Security (25%)
- **Identity-Theft Complaints per Capita - **Regular Weight (2.5)
- **Fraud Complaints per Capita - **Double Weight (5.0)
- **Cyber Crime Victims per 100k - **Regular Weight (2.5)
- **Drug Death Rate - **Double Weight (5.0)
- **Property Crime Rate per 100k - **Regular Weight (2.5)
- **Larceny Thefts per 100k - **Regular Weight (2.5)
- **% of Illicit Drug Use in Adults - **Double Weight (5.0)
Safety & Social Equity (10%)
- Abortions due to Rape Rate - Regular Weight (1.0)
- **% of Domestic Violence Against Women - **Regular Weight (1.0)
- **% of Sexual Harassment - **Double Weight (2.0)
- Workers Fatality Rate per 100k - Regular Weight (1.0)
- **Hate Groups per Capita - **Double Weight (2.0)
- **Hate-Crime Incidents per Capita - **Double Weight (2.0)
- **Deaths due to Intentional self-harm per 100k - **Single Weight (1.0)
Transportation Safety (10%)
- **% of Motorcyclist Fatalities - **Regular Weight (1.2)
- Car Accidents Fatalities Rate - Double Weight (2.4)
- % of Drivers fatalities with known BAC results - Regular Weight (1.2)
- Pedestrian Fatality rate per 100k people - Double Weight (2.4)
- **% of Unrestrained Fatally Injured Occupants - **Half (0.6)
- % of Bicyclists Fatalities - Double Weight (2.4)