States and Their GDPs
One of the crucial barometers of a region's economic health is its Gross Domestic Product (GDP), or as often referred in the United States' context – the Gross State Product (GSP). This numerical figure represents the monetary value of all finished goods and services produced within a state's boundaries in a specific period. Analyzing these GDP figures can provide us with a clearer picture of economic disparities or strengths between different states and help us identify patterns and trends in regional economic health.
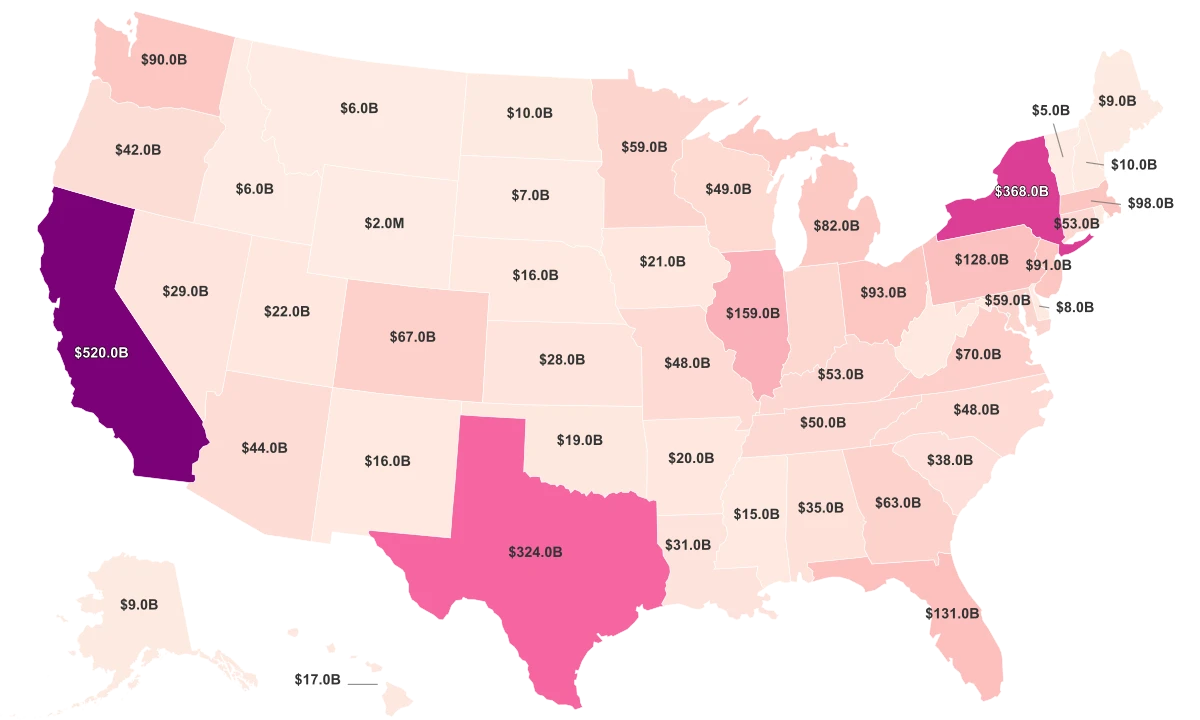
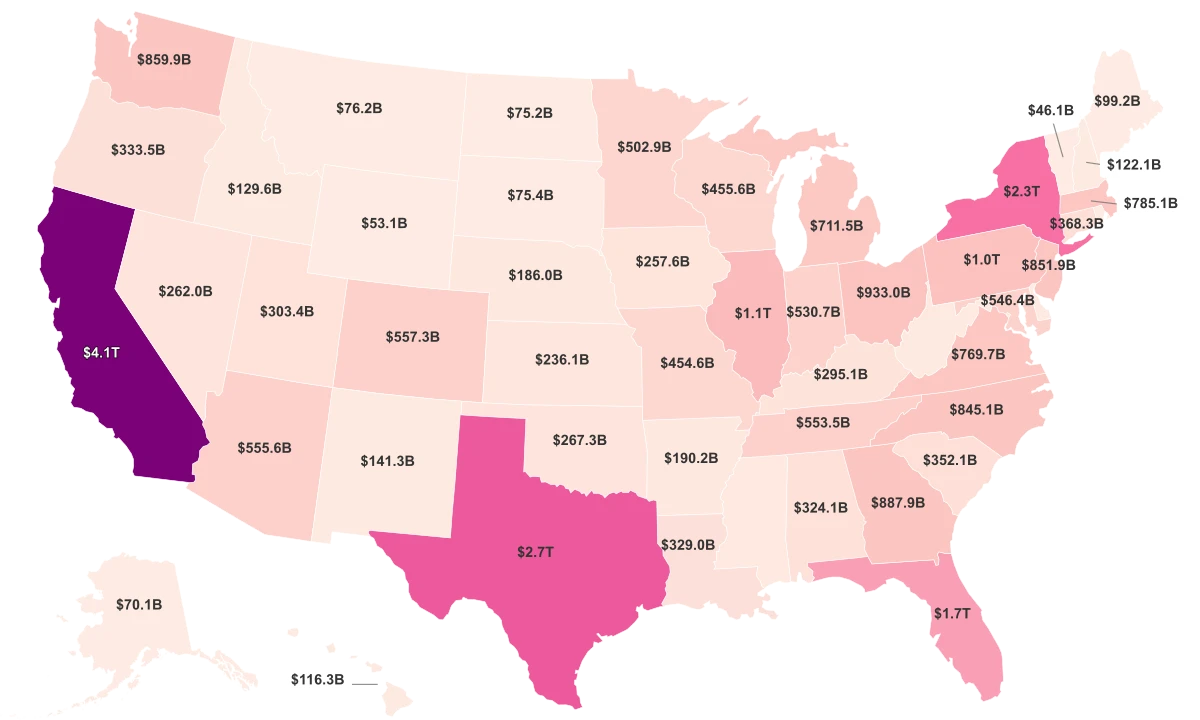
- California, with a GDP of $2.88T, tops the list as the state with the highest GDP, followed by Texas at $1.87T, and New York at $1.56T.
- The top five states - California, Texas, New York, Florida, and Illinois have a combined GDP that exceeds $8.40T, signifying their substantial economic impacts.
- On the other end of the spectrum, smaller states like Vermont and Wyoming see their GDP trailing behind with figures of $31.4B and $36.3B, respectively.
- Patterns in the data indicate that states with larger populations and an emphasis on sectors like technology, finance, and industry tend to have higher GPD values. However, the GDP also depends on internal state policies, educational levels and the balance between various industries.
States with the Highest GDP
Leading the list with the highest GDP is the state of California. The Golden State boasts an impressive GDP of $2.88T, reflecting its stature as a hub of technology, entrepreneurship, and innovation, home to the Silicon Valley and a slew of Fortune 500 companies. Not just an economic powerhouse domestically, California's GDP rivals that of large economies on the global scale and would rank 5th if it were a country. Next in line is Texas with a significant GDP of $1.88T, firmly establishing its status as a robust economic center. The Lone Star State's economy thrives on diverse sectors, including energy, agriculture, technology, and commerce, attributed to both its size and economic policies encouraging business growth. The Empire State, New York, occupies third place with a GDP of $1.56T. With New York City being the world's premier financial center, the state's GDP is heavily influenced by sectors like finance, real estate, and healthcare. Further down the list, we have Florida, registering a GDP of $1.07T. As one of the fastest-growing states, its substantial GDP stems from industries like tourism, agriculture, and international trade. Illinois rounds off the top five with a GDP of $798.0B. Its economic strength comes from diverse sectors such as manufacturing, services, and agriculture, with Chicago being a significant contributor. The rest of our top ten list includes Pennsylvania, Ohio, Georgia, Washington, and New Jersey. These states, with GDP ranging from $726.0B to $581.7B, reflect diversified economies housing industries such as manufacturing, healthcare, technology, and finance. Top 10 states with the Highest GDP:
- California - $2.88T
- Texas - $1.88T
- New York - $1.56T
- Florida - $1.07T
- Illinois - $798.0B
- Pennsylvania - $726.0B
- Ohio - $638.9B
- Georgia - $591.3B
- Washington - $582.2B
- New Jersey - $581.7B